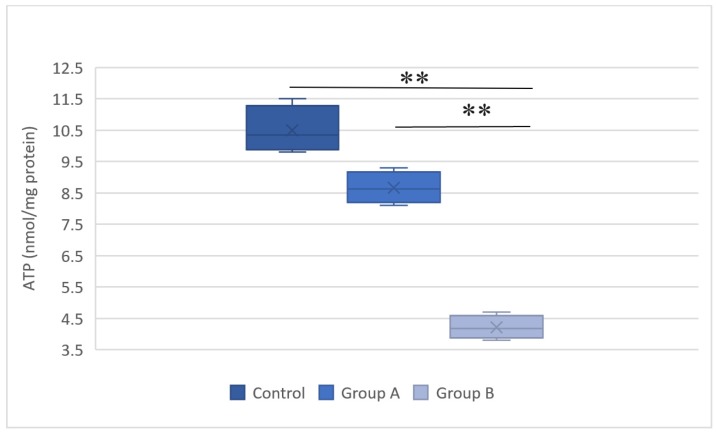
Figure 6.
Representative plot of the adenosine triphosphate (ATP) levels in the hepatic tissue of the control group, group A (hypothermic reperfusion), and group B (normothermic reperfusion). A statistically significant difference was found between groups A (hypothermic reperfusion) and B (normothermic reperfusion). **P < 0.01. ATP, adenosine triphosphate.

