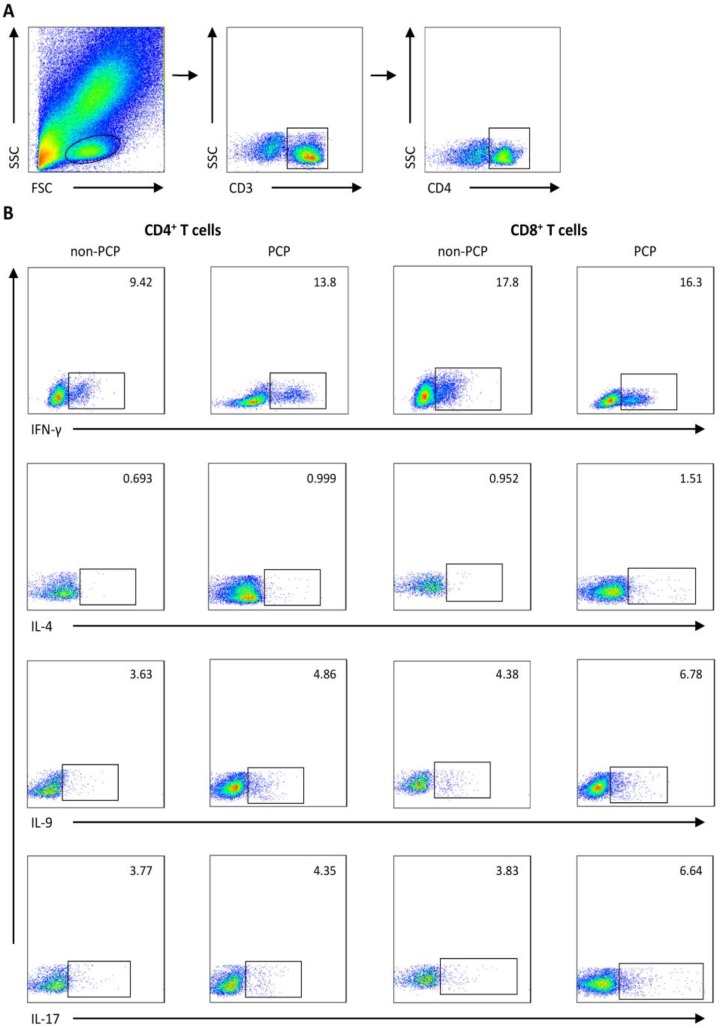
Figure 1.
Representative flow cytometry data. Gating strategy and frequencies of T-cell subsets in blood from 1) a representative patient without Pneumocystis jirovecii pneumonia (PCP), and 2) a patient with PCP are shown. (A) Gating strategies of flow cytometric analysis. (B) Representative plots of subgroups of CD4+/CD8+ T cells sorted by IFN-γ, IL-4, IL-9, and IL-17A expression. FSC: forward scatter characteristics; SSC: side scatter characteristics.

