Figure 2.
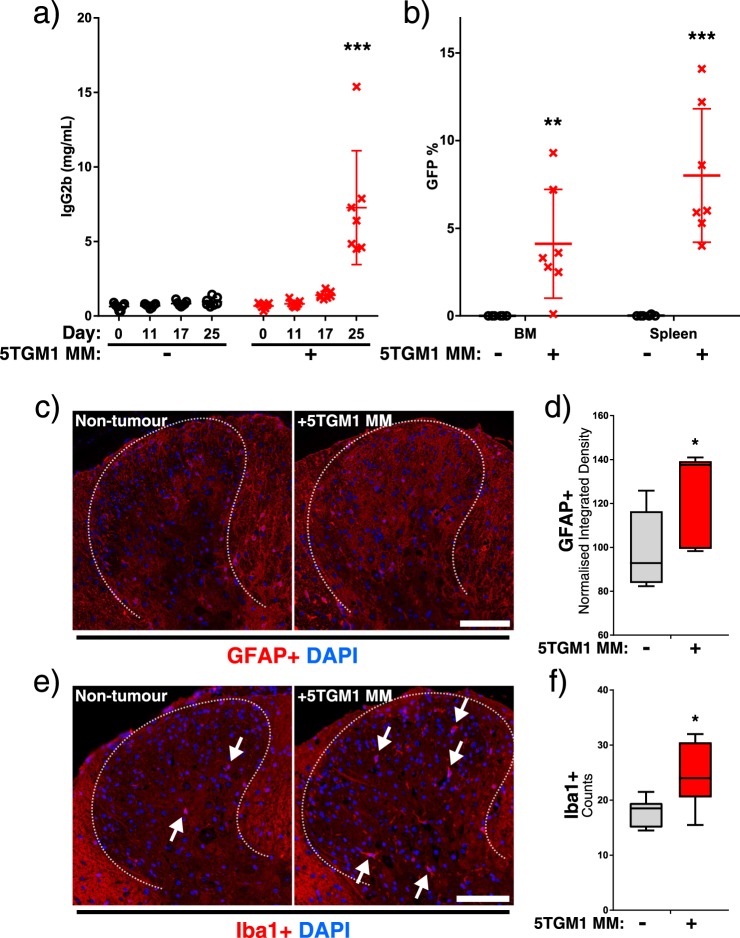
Development of myeloma with associated spinal glial cell activation. (a) Serum IgG2b levels were quantified by ELISA throughout the experiment. Statistical comparison by two-way ANOVA with Sidak’s multiple comparisons test. (b) Flow cytometry analysis of GFP+ (5TGM1) population in bone marrow and spleens, displayed as percentage of total cell count. Statistical comparisons by t-test with Holm-Sidak multiple comparisons correction. (c) Representative images showing GFAP (red channel) staining in dorsal horn region (indicated by dashed line) of T8 spinal cords from non-tumour and 5TGM1 MM-bearing KaLwRij mice, with d) normalised integrated density of GFAP staining. (e) Representative images of Iba1 staining (red channel) in the same region with Iba1+ cell bodies indicated with arrowheads, and (f) cell counts per dorsal horn for non-tumour and MM-bearing mice. All histology images counterstained with DAPI (blue channel), and white scale bars represent 100 µm. Statistical comparisons in (d) and (f) by unpaired Student’s t-test. All statistical comparisons: ns: not significant, *p < 0.05; **p < 0.01; ***p < 0.001.

