Figure 3.
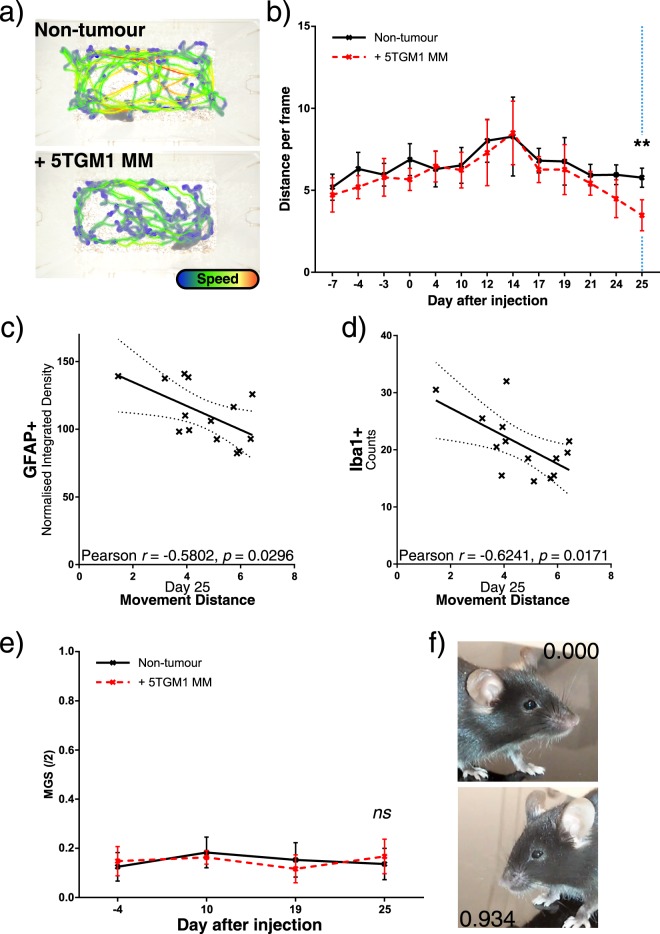
Mouse movement is reduced with tumour burden, and correlates to spinal glial activation. (a) Representative mouse path traces 25 days after tumour or control inoculation, with colour indicating relative instantaneous mouse speed, and (b) average locomotion in two-minute videos taken across the experiment. Statistical comparison by two-way ANOVA with Sidak’s multiple comparisons test. (c) Correlation between day 25 locomotion data and GFAP+ or (d) Iba1+ quantification from previous figure. Pearson’s r correlation coefficient and p value shown. (e) Mouse grimace scores (MGS) out of a maximum of two. Mouse faces were photographed repeatedly at each time point and randomised, then scored by two blinded trained observers, and resulting scores averaged. Mean MGS is shown for each treatment group. Statistical comparison by two-way ANOVA with Sidak’s multiple comparisons test. (f) Average scores for an example control (MGS: 0.000/2.000) and moderate (MGS: 0.934/2.000) grimace image. All statistical comparisons: ns: not significant, *p < 0.05; **p < 0.01; ***p < 0.001.

