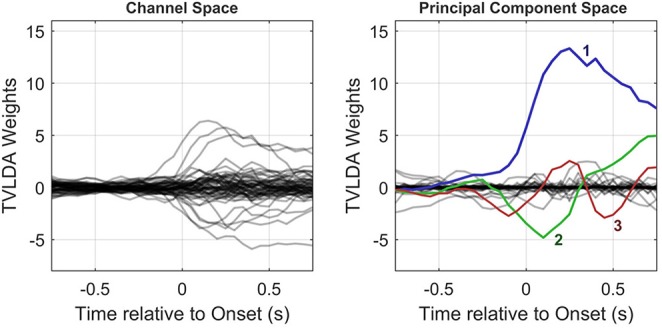
Figure 4.

Column-wise visualization of the original and PCA-transformed spatiotemporal weight matrices Wy (left) and Wx (right), respectively. As illustrated in the right subplot, only few principal components with large amplitudes remain. This allows for substantial dimension reduction, as detailed in the text.
