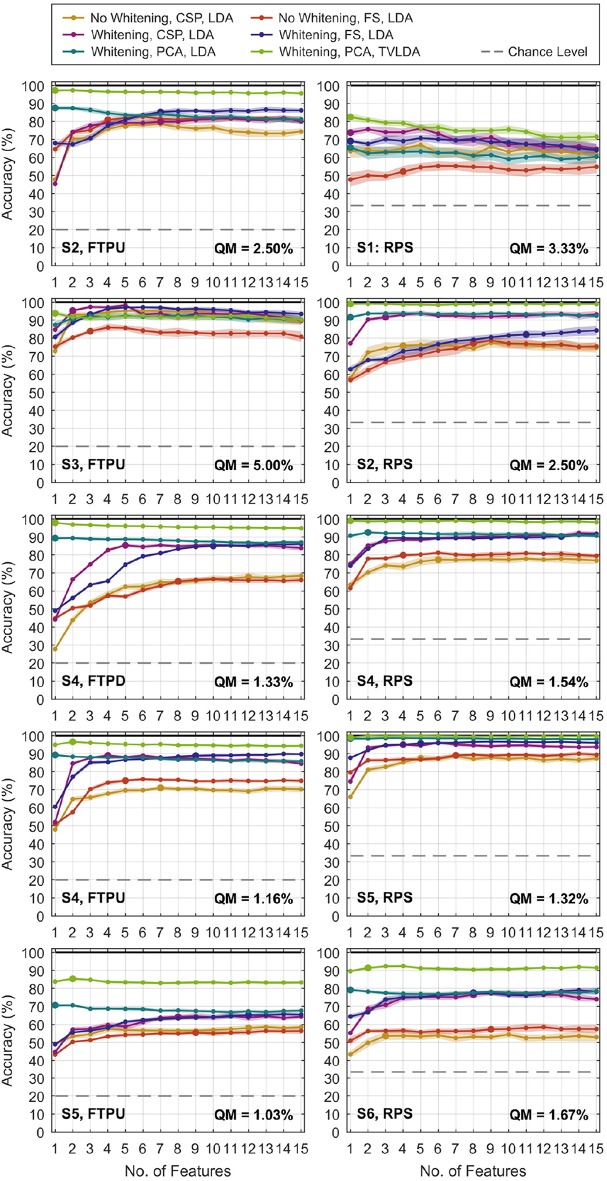
Figure 5.
Classification accuracies versus number of features NF for selected finger-tapping (left) and rock-paper-scissors (right) datasets. Results for rLDA are not shown since NF does not apply. The dots represent the average of 20 repetitions of the randomized cross-validation, and the shaded area indicates the standard deviation. The pronounced dots relate to the representative accuracy, which is defined in the text. Feature selection is abbreviated by “FS” in the legend. The quantization margin is abbreviated by “QM”.

