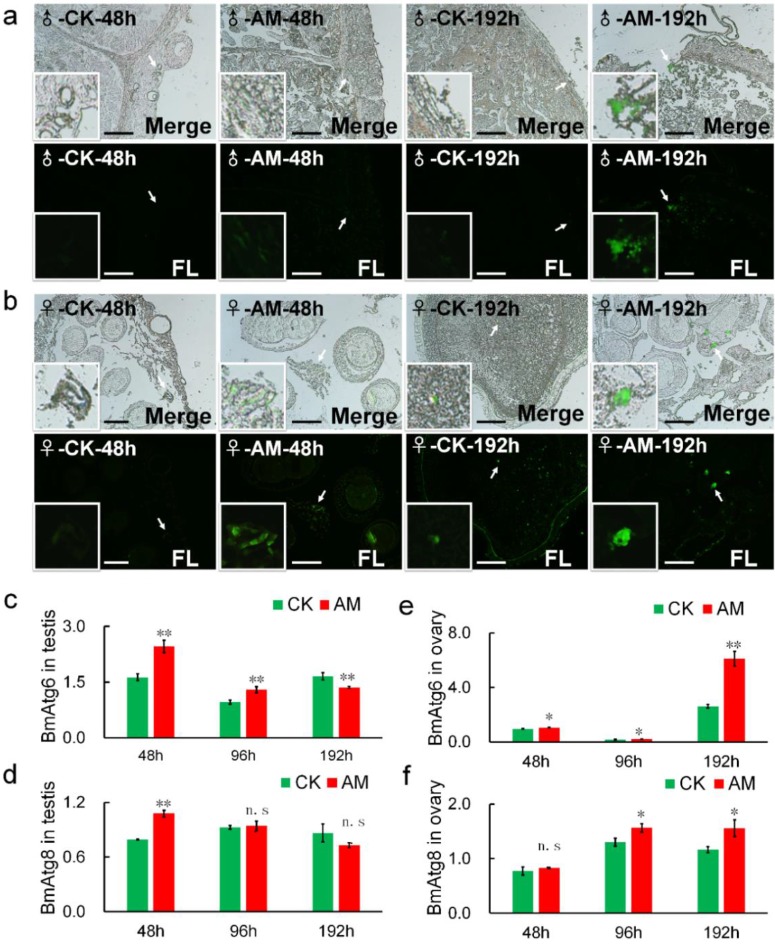
Figure 5.
Changes in the levels of autophagy in testes and ovaries. Autophagy of silkworm testis (a) and ovary (b) cells at 48 and 192 h after modeling, demonstrated by MDC staining. (c-f) mRNA levels of autophagy-related genes BmAtg6 and BmAtg8 in gonad cells from silkworm at 48-192 h after modeling. *P<0.05; **P<0.01; n.s., no significant difference between the two groups. Bar = 100 μm.

