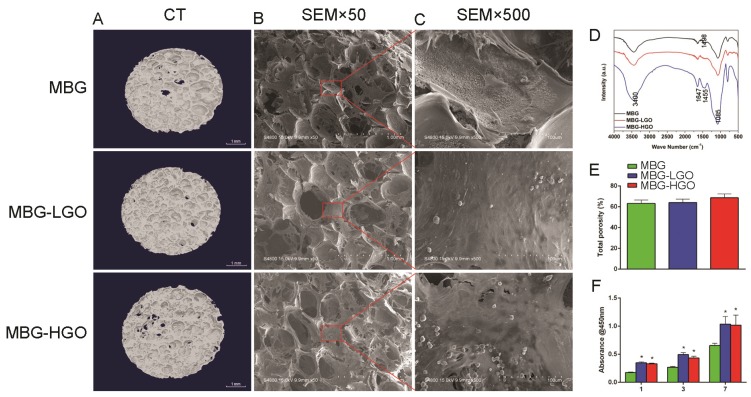
Fig 2.
(A) 3D images of scaffolds by Micro-CT. (B-C) The pore size and cell adhesion of scaffold by SEM. (D) The phase composition of the scaffolds were characterized by FTIR. (E) Quantitative analysis of total porosity. (F) The proliferation of rBMSCs cultured with scaffolds extracts. (* represent p < 0.05 when compared with MBG).

