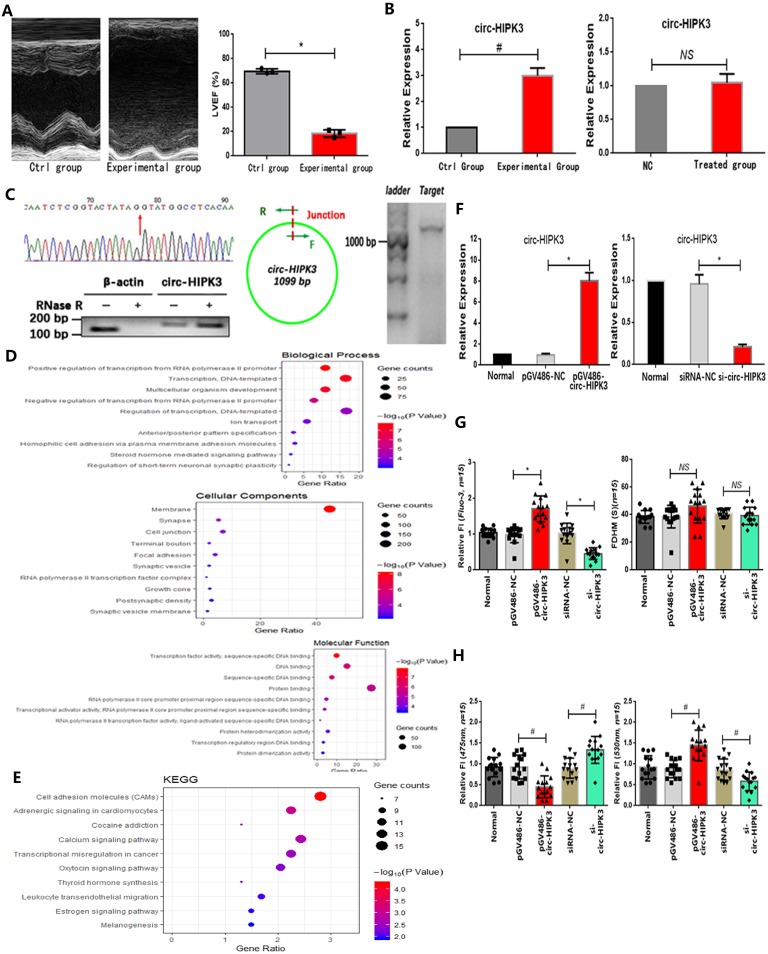
Figure 1.
The identification of circ-HIPK3. (A) Left: Image of echocardiography showing enlargement of cardiac chambers and thinning of cardiac wall in experimental group; Right: Index LVEF decreased significantly in experimental group. * p < 0.05. (B) Two bar graphs showing that circ-HIPK3 increased significantly in experimental group but not in oxygen-glucose deprived CMs. # p < 0.05, NS = not significant. (C) Left upper: The result of Sanger sequencing of junction of circ-HIPK3. Red arrow points the junction; Left lower: Representative image of circ-HIPK3 digested by RNase R or not normalized by linear mRNA of β-actin; Middle: A pair of primer both containing junction can amplify the entire circ-HIPK3; Right: Agarose gel electrophoresis showed that the length of products was ~1099 bp. (D)(E) Bubble graphs showed the results of GO and KEGG analysis. (F) Left: The plasmids: pGV486-circ-HIPK3 can increase the level of circ-HIPK3 significantly; Right: the siRNA of circ-HIPK3 junction can decrease it remarkably. * p < 0.01. (G) Left: Results showing that circ-HIPK3 overexpression can increase the peak fluorescence intensity (FI) of Fluo-3 and vice versa; Right: bar graphs showing that up- or down-regulation of circ-HIPK3 had no influences on the time duration of calcium transient (FDHM). * p < 0.05, NS =not significant, n = 15. (H) Left: the circ-HIPK3 overexpression can decrease the FI of 475nm while its reduction can increase the FI; Right: the 530nm FI was increased by circ-HIPK3 overexpression and decreased by reduction. # p < 0.05, n = 15.

