Figure 2.
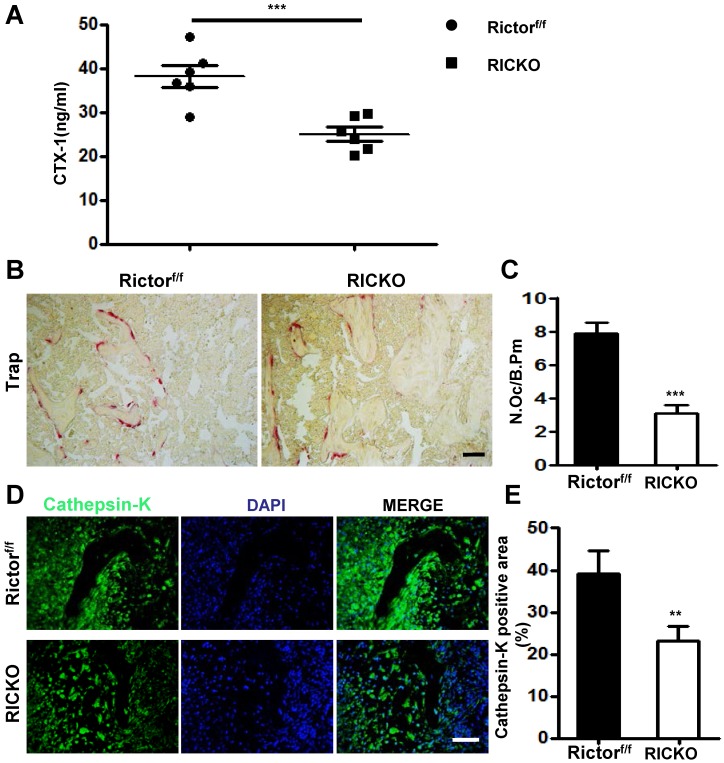
Rictor ablation in BMSCs decreases osteoclast formation in vivo.(A) Serum CTX-1 levels. (B) Representative images of TRAP staining in metastatic sites. (C) Quantification of osteoclast number normalized to trabecular bone surface. (D) Representative images of Cathepsin-K staining at the tumor-bone interface. (E) Quantification of Cathepsin-K-positive area relative to section area. Scale bar=50 µm. All bar graphs show mean ± SEM. **P <0.01, ***P< 0.001.

