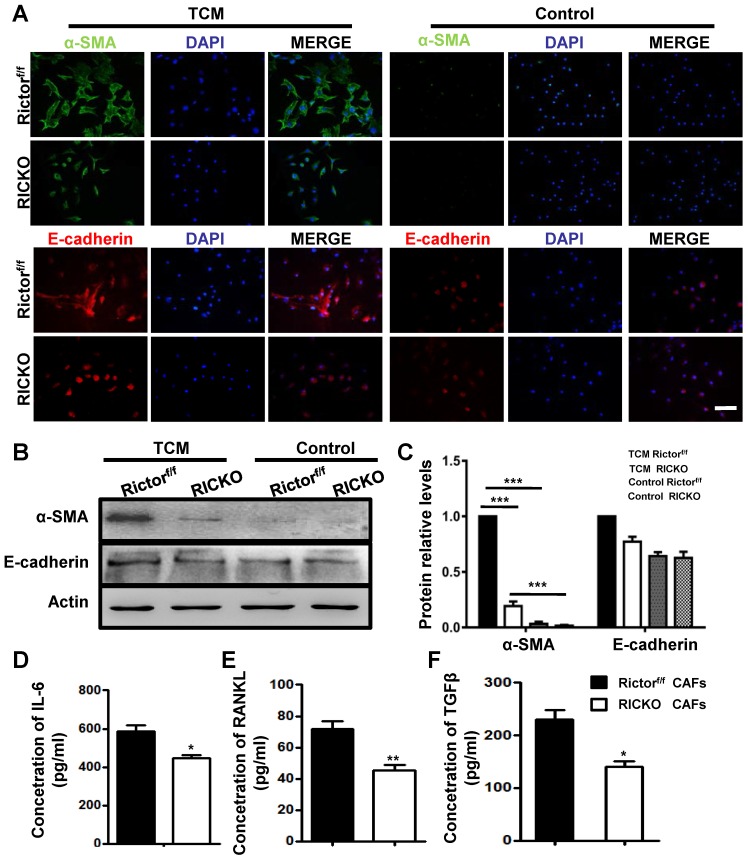
Figure 4.
Loss of Rictor inhibits the transition of BMSCs to Cancer associated fibroblasts (CAFs).(A) Representative images of α-SMA and E-cadherin staining of BMSCs cultured in TCM or normal medium (for control). (B) Western blot analyses of α-SMA and E-cadherin expression in BMSCs cultured in TCM or normal medium.(C) The protein expression levels are calculated as a ratio to the Actinprotein level and expressed relative to levels in group of TCM Rictorf/f. (D-F) Quantitation of cytokine levels by ELISA. Scale bar=100 µm. All bar graphs show mean ± SEM. *P <0.05; **P< 0.01; ***P< 0.001.

