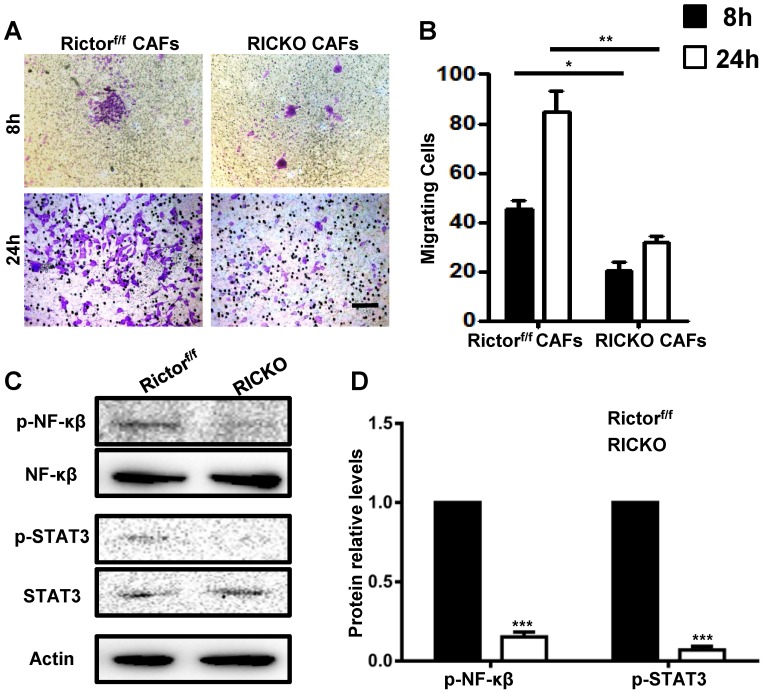
Figure 7.
Rictor deficiency weakens the chemotactic attraction of CAFs to TM40D cells.(A) Representative images of migratory TM40D cells that were co-cultured with CAFs for 8 or 24h.(B) The calculated number of TM40D cells. (B) Western blot analyses of downstream proteins of IL-6 and RANKL.(C) The protein expression levels of p-NF-κβ and p-STAT3, calculated as a ratio to the NF-κβ and STAT3protein levels respectively, and expressed relative to levels in group of Rictorf/f. Scale bar=100 µm. All bar graphs show mean ± SEM. *P <0.05; **P <0.01; ***P< 0.001.

