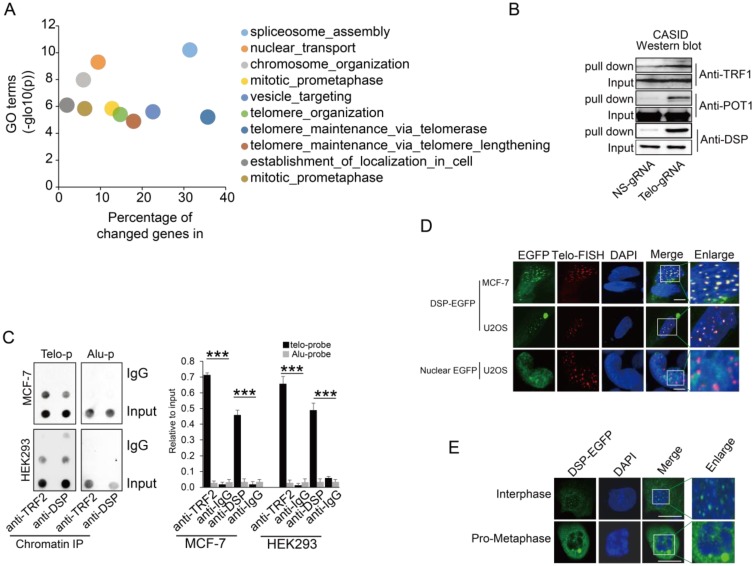
Figure 2.
A. Gene ontology analysis of proteins identified by CASID targeting telomeres. B. Western blot detection of TRF1, POT1, and DSP in the proteins pulled down by CASID with the presence of telo-sgRNA in HEK293 cells. Input represents the initial nuclear extract before the pull-down mediated by CASID. C. left, ChIP assay of telomere binding of TRF2 or DSP in MCF-7 cells and HEK293 cells. The chromatin DNA precipitated by anti-DSP and anti-TRF2 antibodies were analyzed by dot blot using the probes recognizing telomere (Telo-p) or Alu DNA repeats (Alu-p). The detection of Alu DNA repeats serves as negative control. The dot-blot was performed at least three times and the represented one is shown. Right, the histogram shows the quantitated results of the dot blots. The triple asterisks (***) indicates a p-value less than 0.01. D. Fluorescence imaging of DSP-EGFP in MCF-7 cells and U2OS cells. The EGFP signal indicates the localization of DSP-EGFP (green) and the Telo-FISH signal indicates the localization of telomeres (red). The overlapping between DSP-EGFP and Telo-FISH is in yellow as revealed in the enlarged nuclear area. The dCAS9-EGFP construct without telo-sgRNA was used for U2OS transfection and the imaging of EGFP serves as negative control. E. DSP localization in interphase and pro-metaphase nucleus. DSP-EGFP indicates the DSP locations and DAPI indicates the nucleus.

