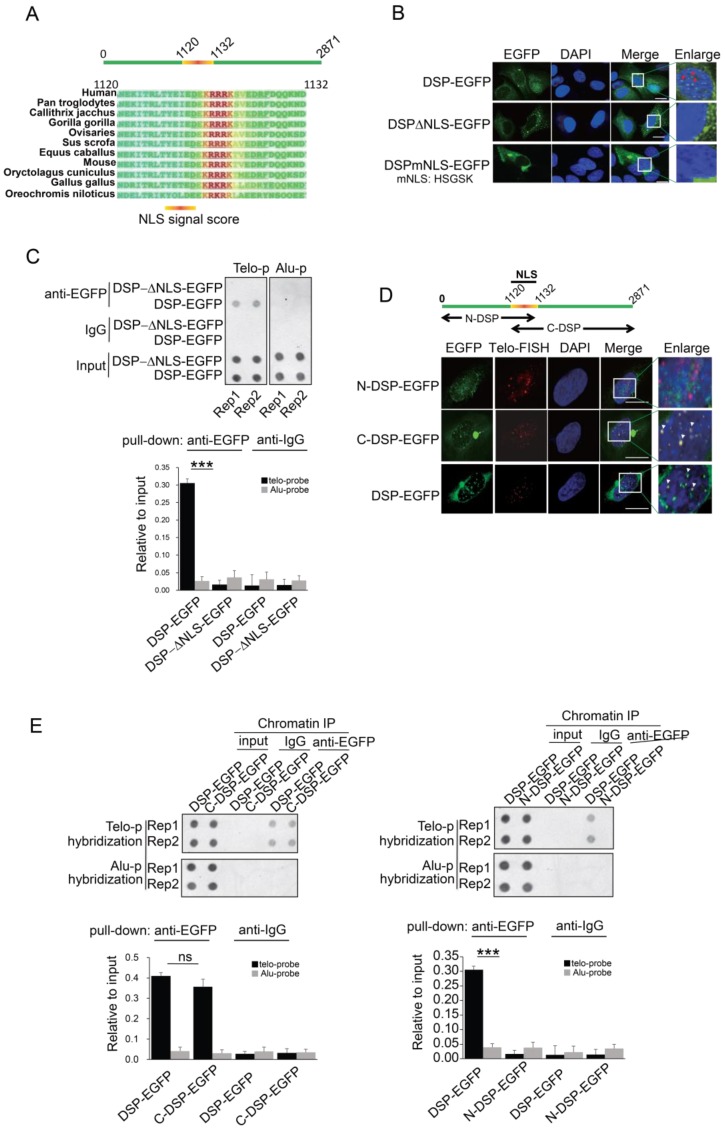
Figure 3.
A. Prediction of NLS sequence in DSP using Nucpred algorism is shown at the top. The conservation of the NLS of DSP across many species is shown at the below. B. Fluorescence imaging of the nuclear localization of DSP-EGFP fusion protein and the cytoplasmic only localization of DSP△NLS-EGFP and DSPmNLS-EGFP. The red arrows indicate the green dots formed by DSP-EGFP in nuclei. C. Top, ChIP assay using anti-EGFP antibody in the HEK293 cells transfected with either DSP-EGFP fusion protein or DSP△NLS-EGFP mutant. Alu DNA repeats serve as negative control. The dot-blot was performed at least three times and the represented one is shown. Bottom, the histogram shows the quantitated results of the dot blots. The triple asterisks (***) indicates a p-value less than 0.01. D. Fluorescence imaging of N-DSP-EGFP and C-DSP-EGFP fusion proteins (green) in HEK293 cells. The overlapping between EGFP (green) and Telo-FISH (red) is in yellow as revealed in the enlarged nuclear area (white arrows). DAPI indicates the nucleus. E. Top, ChIP assay using anti-EGFP antibody in cells transfected with C-DSP-EGFP (left) or N-DSP-EGFP (right). Alu DNA repeats serve as negative control. The dot-blot was performed at least three times and the represented one is shown. Bottom, the histograms show the quantitated results of the dot blots. The triple asterisks (***) indicates a p-value less than 0.01 and ns. indicates the insignificant difference.

