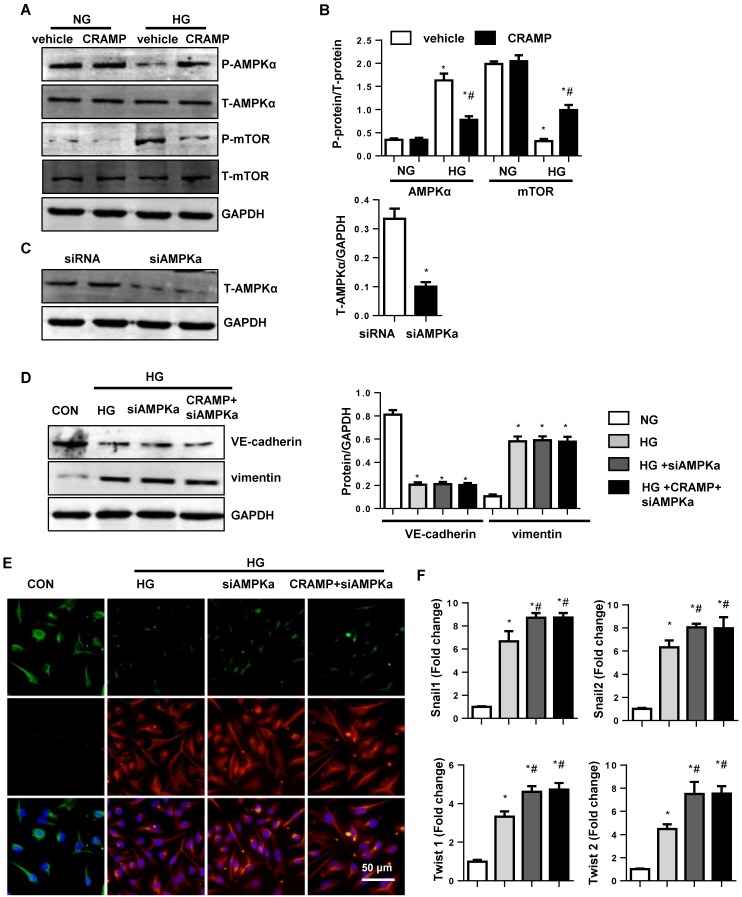
Figure 6.
The effects of CRAMP on AMPKa signalling. A and B. Representative western blot (A) and analysis (B) of P-AMPKa1, T-AMPKa1 P-mTOR, and T-mTOR in MHECs treated with CRAMP (100 μg/L) (n=6 samples). *P<0.05 vs the corresponding NG; #P<0.05 vs vehicle-HG. C-F. MHECs were treated with CRAMP (100 μg/L) and AMPKa1 siRNA and exposed to HG. C. The expression of AMPKa1 after cells were treated with siRNA (n=6 samples). D. The expression level of VE-cadherin and vimentin in the indicated group (n=6 samples). E. Immunofluorescence staining of VE-cadherin and vimentin in the indicated group (n=6 samples). F. PCR analysis of EndMT markers (snial1, snial2, twist1, twist2) in MHECs (n=6 samples). *P<0.05 vs the siRNA; #P<0.05 vs HG-siRNA.

