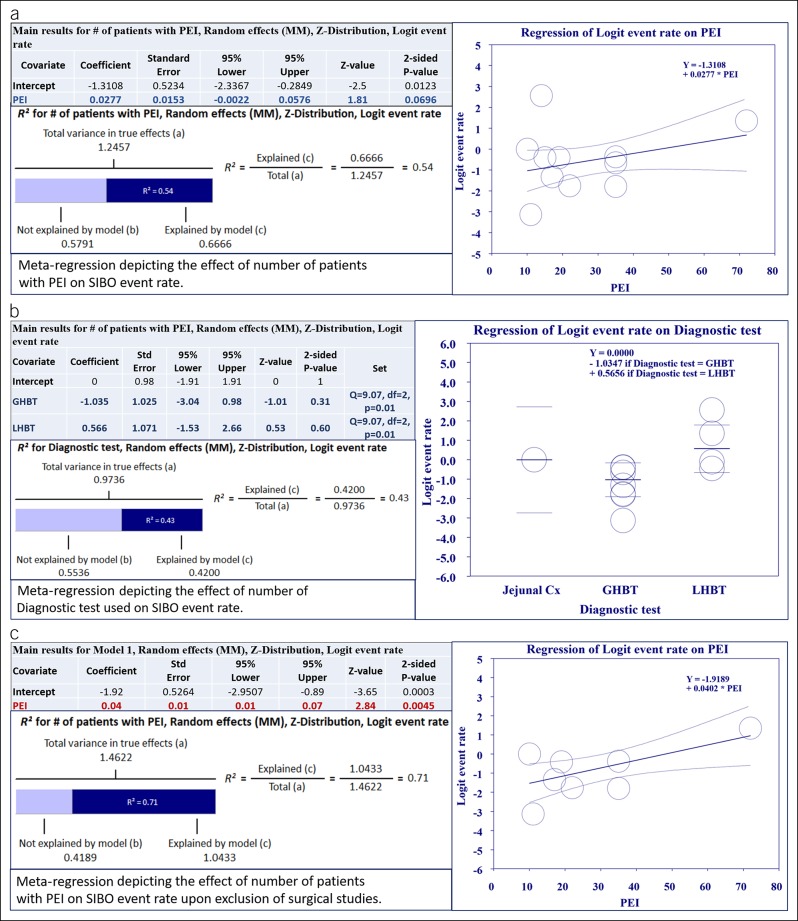
Figure 3.
Meta-regression results for PP analysis: (a) Meta-regression exploring the relationship between the SIBO event rate in CP and number of patients with PEI. As indicated in the accompanying table, correlation was not statistically significant. Despite that, the regression model was able to explain 54% (R2) of between-study variance in PP. (b) Meta-regression exploring the relationship between the SIBO event rate and the diagnostic test used. As indicated in the accompanying table, the correlation was statistically significant. The logistic regression model was able to explain 43% (R2) of between-study variance in PP. (c) Meta-regression exploring the relationship between the SIBO event rate in CP and number of patients with PEI after exclusion of studies with surgical patients. As indicated in the accompanying table, the correlation was statistically significant and able to explain 71% (R2) of between-study variance in PP. R2 calculation: (a) To compute the total variance (of all studies about the grand mean), we run the regression with no covariates. (b) To compute the variance not explained by the model (of all studies about the regression line), we run the regression with the covariates. (c) The difference between these values gives us the variance explained by the model. CP, chronic pancreatitis; GHBT, glucose hydrogen breath test; LHBT, lactulose hydrogen breath test; PEI, pancreatic exocrine insufficiency; PP, pooled prevalence; SIBO, small intestinal bacterial overgrowth.

