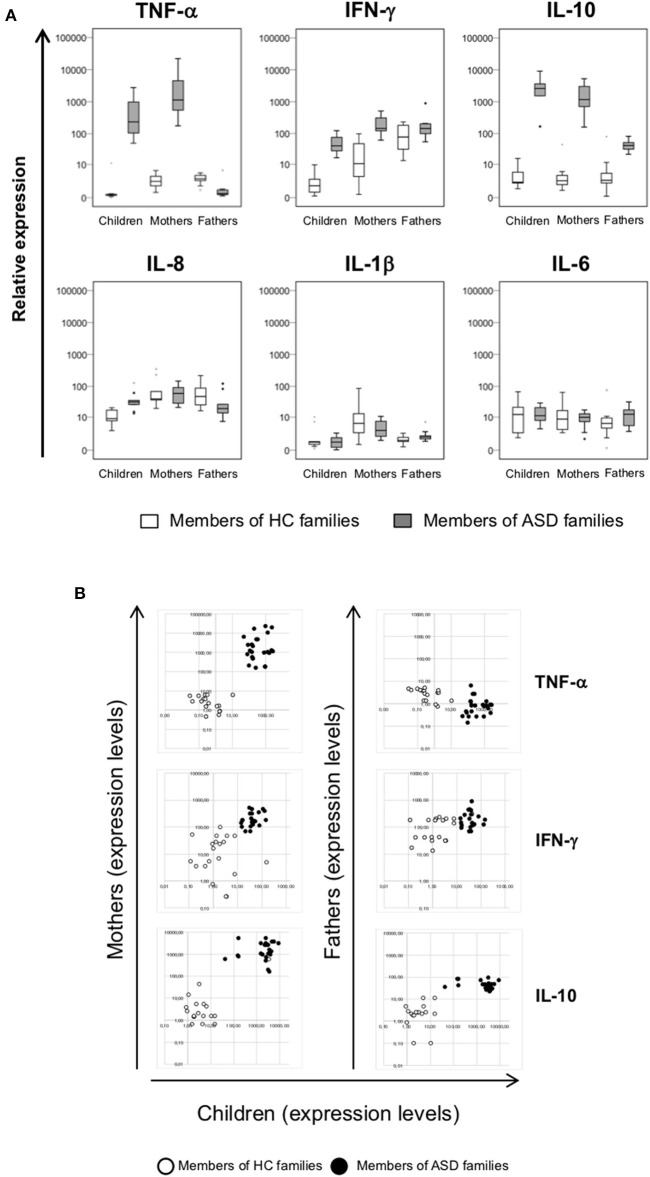
Figure 3.
(A) Relative expression of TNF-α, IFN-γ, IL-10, IL-8, IL-1β, and IL-6 in PBMCs from patients with ASD and their parents in comparison to healthy control individuals. Cytokines expression levels were analyzed in PBMCs of children, mothers, and fathers of healthy control families (HC families, white) and of children with ASD and their parents (ASD families, gray) by RT-Real time PCR. The results are represented as box plots, depicting mild (black dot) and extreme outliers (asterisk) for each group. (B) Scatter plots of cytokines expression in children vs. their parents. Dots depicted in white and black are related to data obtained from HC and ASD families, respectively.

