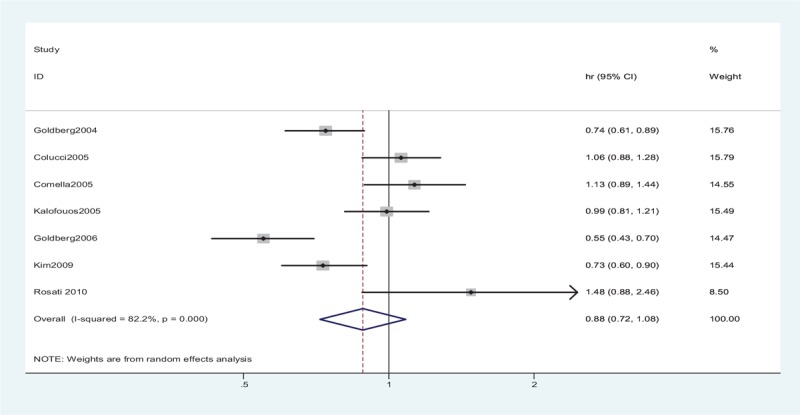
Figure 3.

Random-effects model of HR (95% CI) of time to progression associated with the irinotecan group compared with the oxaliplatin group. No striking heterogeneity was found in the time to progression (P < .001, I2 = 82.2%) in studies. A random-effects model was applied to the meta-analysis. No significant differences were observed in TTP between the 2 groups (P = .24). CI = confidence interval, df = degrees of freedom, HR = hazard ratio, TTP = time to progression.
