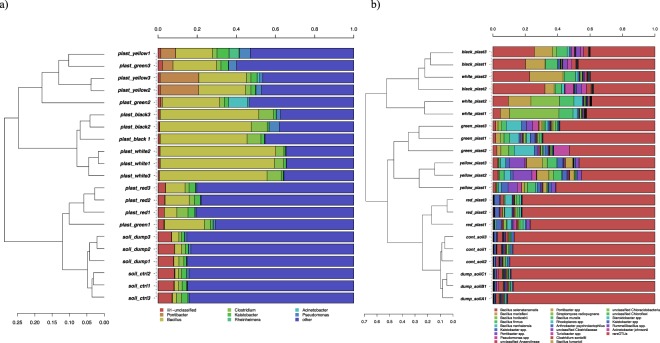
Figure 4.
Hierarchical clustering of sequences classified at the genus level (a) or OTUs classified at species level. Bars of different colours indicate the different percentages of genera (a) or species (b) identified in each sample. Only taxa participating with >5% in at least one sample are presented for the genus level analyses (a), while for the OTU-level (b), a cut-off was applied to include OTUs covering the 95% of total diversity. Taxa with lower participation were added to the “other” groups.

