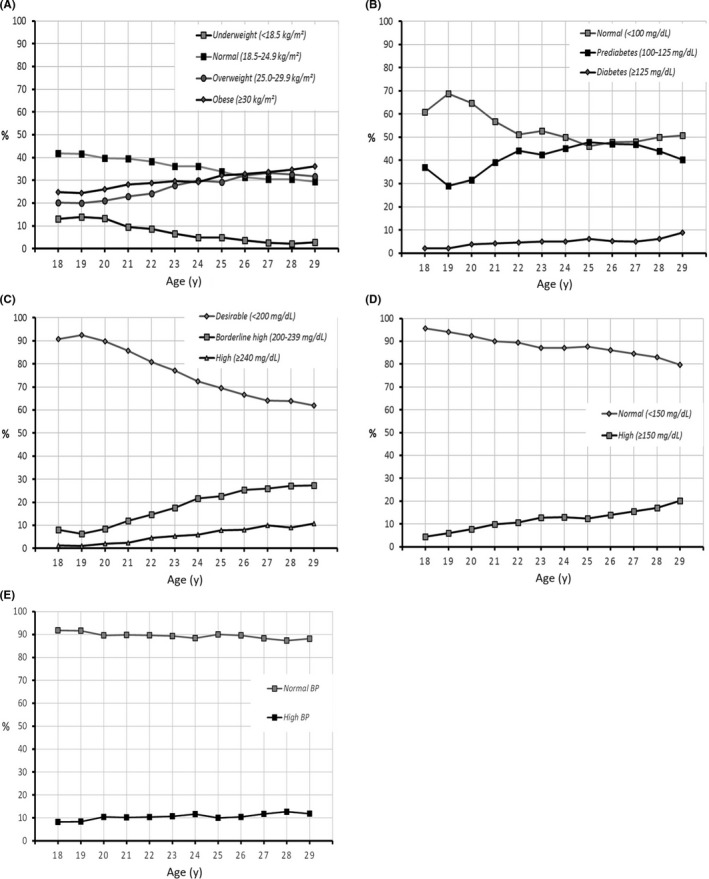
Figure 1.

Body mass index, metabolic markers and blood pressure as a function of age. A, Body mass index (N = 31 610); B, fasting blood glucose (N = 27 339); C, total cholesterol (N = 27 089); D, triglycerides (N = 27 032); and E, blood pressure (N = 31 574). Data are presented as the proportion of subjects in each risk factor class as a function of age, for all subjects in whom a valid measure was available (N)
