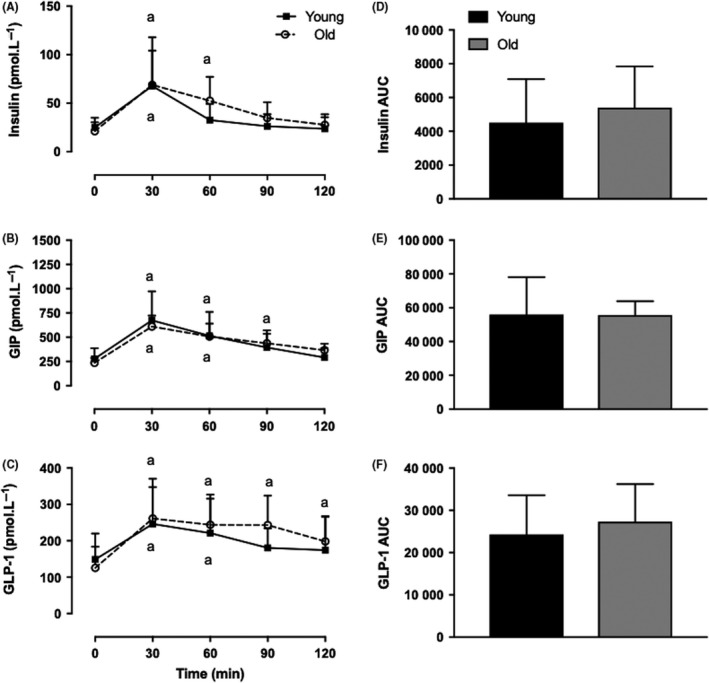
Figure 5.

Young vs Old plasma insulin and incretin hormone release following oral consumption of 15 g EAA. Insulin (A), GIP (B) and GLP‐1 (C) concentrations, demonstrated with AUC in (D), (E) and (F), respectively. aGreater than respective baseline (P < 0.05). Main effects of feeding, P < 0.0001; effects of age, NS; Interaction, NS. Values are expressed as mean ± SD. Measured by 2‐way ANOVA. EAA, essential amino acids; GIP, glucose‐dependent insulinotropic peptide; GLP‐1, glucagon‐like peptide‐1
