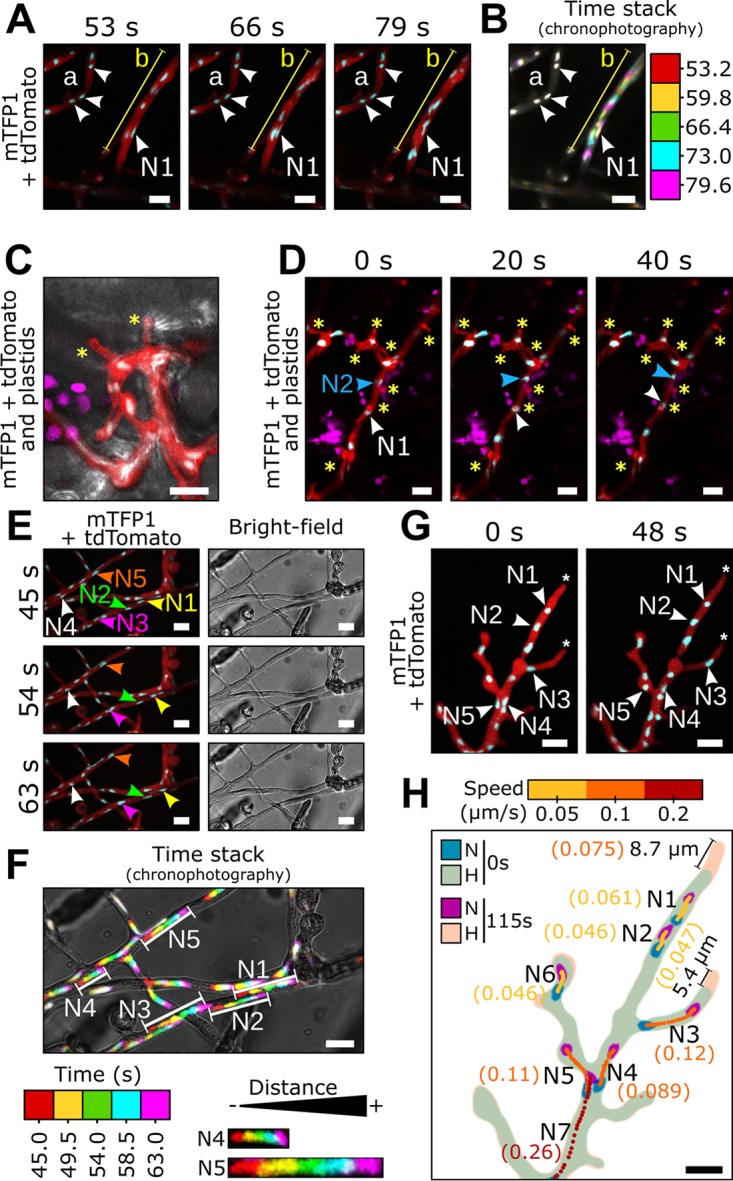
FIG 3.

Differential nuclear migration rates occur throughout P. palmivora hyphal network. Time-lapse imaging of P. palmivora LILI-td-NT hyphae infecting an N. benthamiana leaf (A to D, videos 3 and 4) or growing axenically on V8 medium (E to H, videos 5 and 6). (A, video 3) Representative sequence of nuclear movements within infectious P. palmivora hyphae. (B, video 3) Chronophotographic display (time stack) of the sequence shown in panel A. The successive time frames are color coded and overlaid. (C) Representative sequence of P. palmivora haustoria (asterisks) on an N. benthamiana leaf. Arrowheads indicate nuclei. (D, video 4) Representative sequence of nuclear movements within haustoriated P. palmivora hyphae. (E, video 5) Representative sequence of nuclear migration on axenically grown mycelium. (F, video 5) Chronophotographic display of the sequence shown in panel E. (G, video 6) Representative sequence of nuclear movements near hyphal tips. (H) Nuclear trajectories for seven nuclei at the hyphal tip. Average speed is indicated in parentheses. Lines indicate hyphal segments. Arrowheads indicate individual nuclei. N, nuclei; H, hyphae. Bar, 10 μm.
