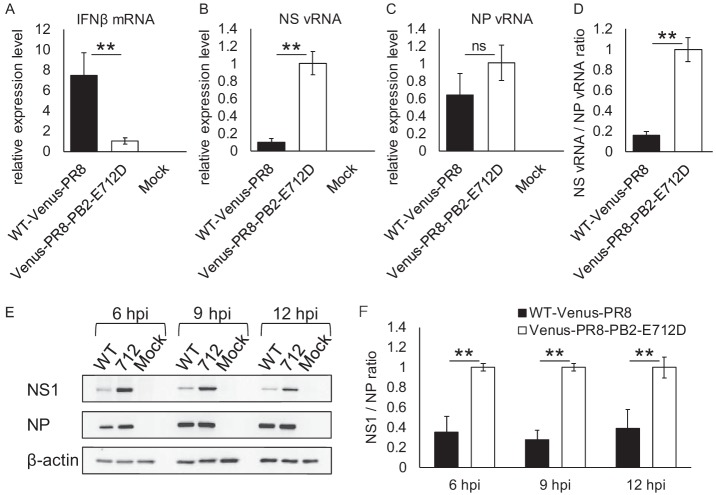
FIG 3.
RNA and protein expression in infected cells. (A to C) MDCK cells were infected with each virus at an MOI of 1. The relative expression levels of IFN-β mRNA (A), NS vRNA (B), and NP vRNA (C) were determined by quantitative real-time PCR at 9 h postinfection. (D) The NS vRNA/NP vRNA ratio was calculated. (E) MDCK cells were infected with WT-Venus-PR8 (WT) or Venus-PR8-PB2-E712D (712) at an MOI of 1. Cells were lysed at the indicated time points, and the expression of NS1, NP, and β-actin was detected by Western blotting. (F) NS1/NP ratios were determined based on the band intensity of the Western blotting. Means ± the standard deviations of triplicate experiments, taking each value in Venus-PR8-PB2-E712D-infected cells as 1, are shown in panels A, B, C, D, and F. **, P < 0.01; ns, not significant (Student t test); hpi, hours postinfection.

