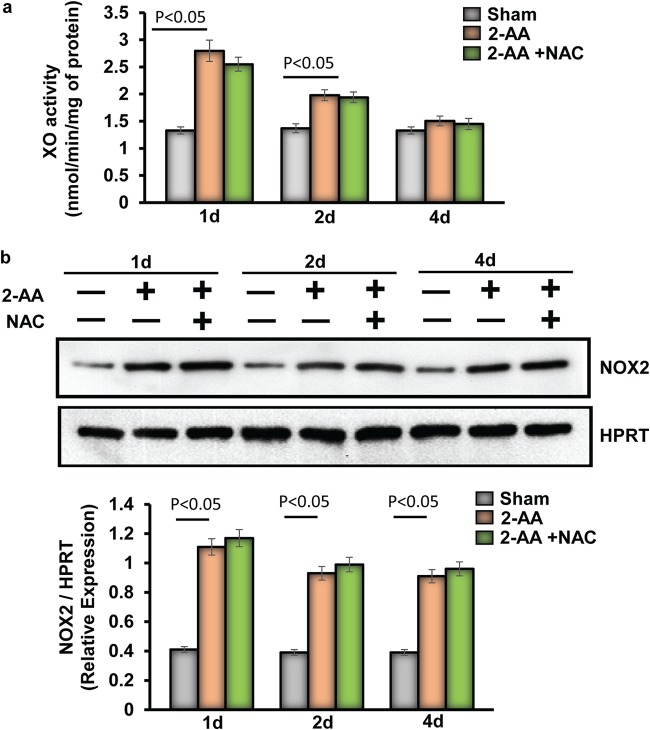
FIG 3.
Assessment of XO activity and NOX2 protein expression in skeletal muscle of 2-AA-treated mice. (a) XO activity was measured in skeletal muscle 1 day, 2 days, and 4 days after 2-AA treatment and 2-AA-plus-NAC treatment (n = 5 in each group). The results were expressed as means ± SD. P < 0.05, one-way ANOVA. (b) Representative immunoblot of NOX2 in skeletal muscle 1 day, 2 days, and 4 days after 2-AA treatment and 2-AA-plus-NAC treatment. HPRT (bottom) was used as the loading control. Histograms show the relative expression levels of proteins. n = 5 in each group; data represent means ± SD. P < 0.05, one-way ANOVA.

