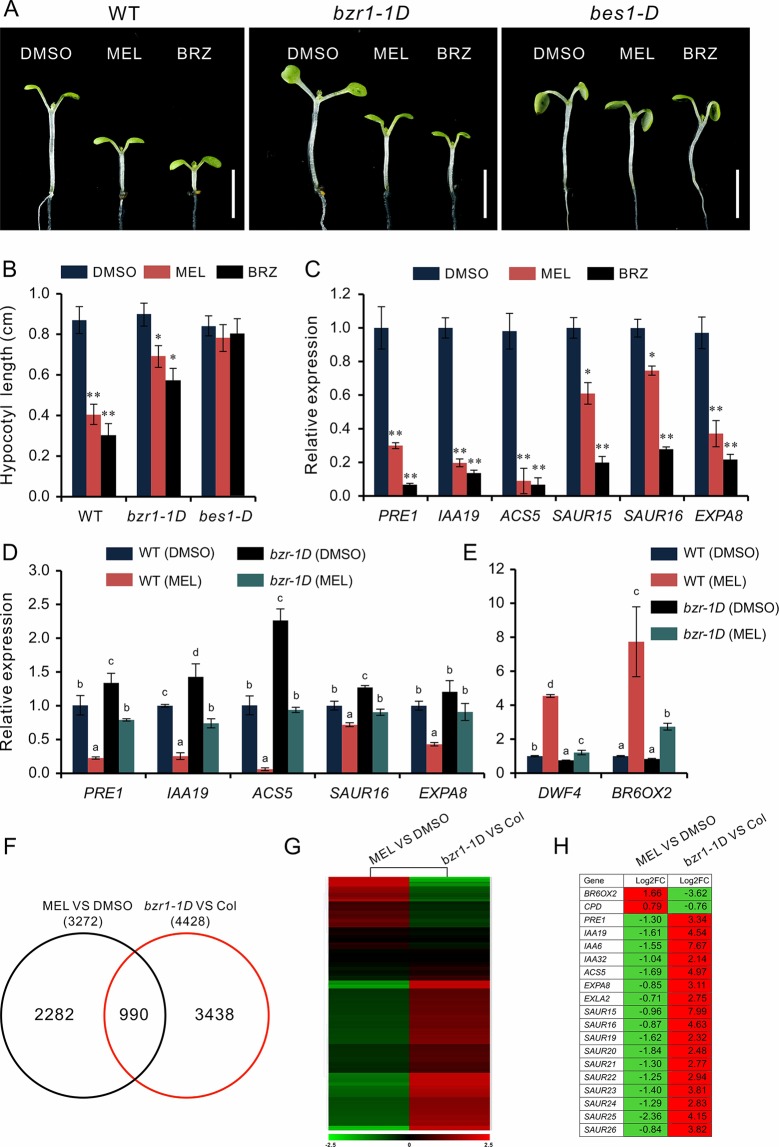
Figure 4.
High-dose melatonin represses BR signaling. (A, B) Four-day-old seedlings of WT, bzr1-1D, and bes1-D were transferred on medium containing 1 mM of melatonin (MEL), 1 µM brassinazole (BRZ), or 0.1% DMSO (solvent control) for 3 days in darkness. Scale bar represents 0.5 cm. *p < 0.05, **p < 0.01 (Student’s t test). Error bars indicate the SEM (n ≥ 40). (C) qRT-PCR analyses of expression of BR-related genes in WT seedlings under treatment of MEL, BRZ, and DMSO (control). Data are represented as means ± SD (n = 3), *p < 0.05, **p < 0.01 (Student’s t test). (D, E) Expression level analysis of BR-related genes in both WT and bzr1-1D after being treated with melatonin. Significant differences (p < 0.05) are denoted by different lowercase letters. (F) Venn diagram displaying the overlapping genes regulated by melatonin and BZR1. (G, H) Hierarchical cluster analysis of 990 overlapping genes and the representative genes in BR signaling are listed. Red and green colors in the heatmap represent induced and repressed genes, respectively. BR, brassinosteroid; DMSO, dimethyl sulfoxide; qRT-PCR, real-time polymerase chain reaction; SEM, standard error of the mean; WT, wild type.

