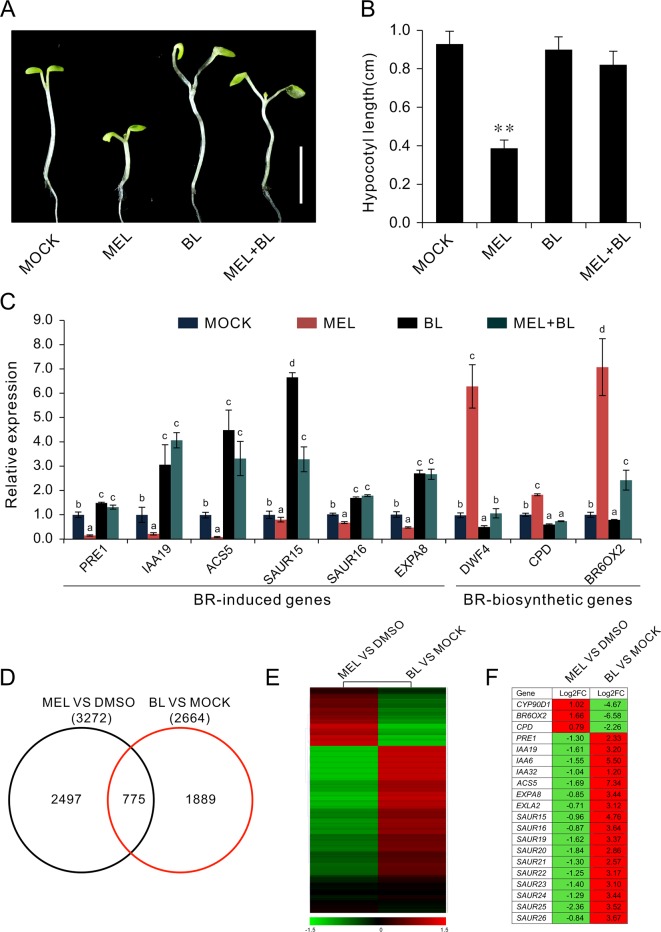
Figure 5.
BL antagonizes melatonin in the regulation of hypocotyl elongation. (A) Additional BL restores hypocotyl elongation against a high concentration of melatonin. Four-day-old seedlings grown on 1/2MS under light were transferred on medium containing 1 mM of melatonin with indicated concentration of BL for another 3 days in darkness. Scale bar represents 0.5 cm. (B) The corresponding hypocotyl length.*p < 0.05, **p < 0.01 (Student’s t test). Error bars indicate the SEM (n ≥ 40). (C) qRT-PCR analyses showing the expression of BR-related genes. Significant differences (p < 0.05) are denoted by different lowercase letters. (D) Venn diagram displaying the overlapping genes induced by melatonin and BL. (E, F) Hierarchical cluster analysis of 775 overlapping genes and the representative genes in BR signaling are listed. Red and green colors in the heatmap represent induced and repressed genes, respectively. BL, brassinolide; MS, Murashige and Skoog; qRT-PCR, real-time polymerase chain reaction; SEM, standard error of the mean.

