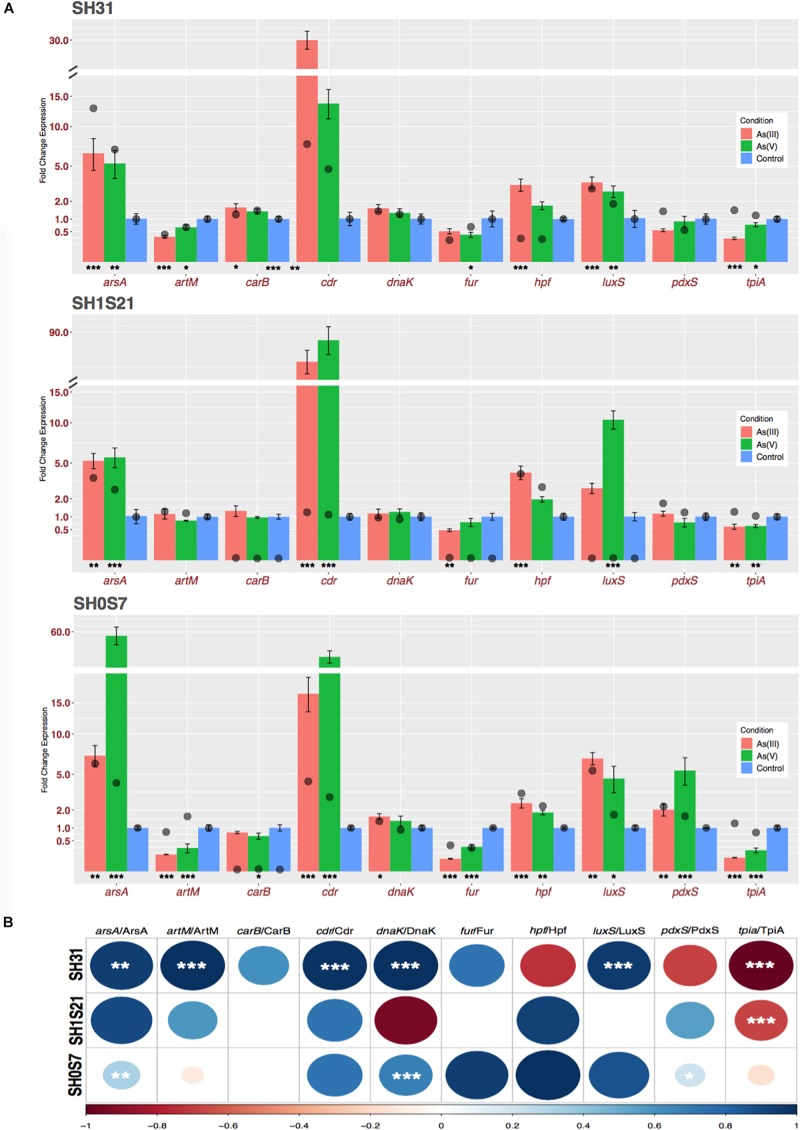
FIGURE 4.
Transcriptomic expression of genes that code for the identified proteins. (A) Gene and protein fold change expression: Bars represents relative fold change gene expression related to control condition of selected genes, measured under the same As conditions as in the proteomic experiments (colored by condition). Plotted data is an average of three independent experiments with three technical replicates each. Asterisks represent statistical significance of transcriptional expression experiments both As compared to control condition. The protein mean fold changes (three independent experiments) obtained from proteomic analysis are represented by the black circles. The data for both As conditions are represented relative to the control values. (B) Correlation index between transcriptional and protein fold change expression values. Positive correlations are displayed in blue and negative correlations in red color. Color intensity and circle size are proportional to the correlation coefficients; asterisks represent statistical significance. ∗p ≤ 0.05; ∗∗p ≤ 0.01; and ∗∗∗p ≤ 0.001.

