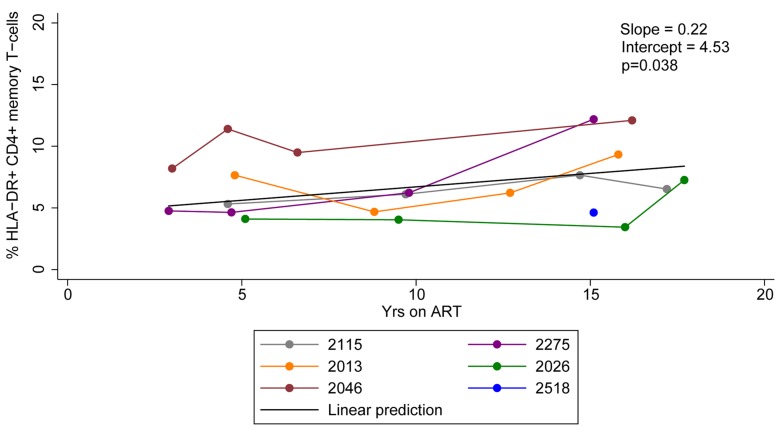
FIGURE 1.
HLA-DR expression on CD4+ memory T-cells during ART. Proportions of CD4+ memory T-cells that express HLA-DR during ART were quantified. The linear prediction was performed using mixed effects regression. The slope indicates change of the proportion of HLA-DR+ CD4+ memory T-cells per year on ART and p-value (p) is for the slope.

