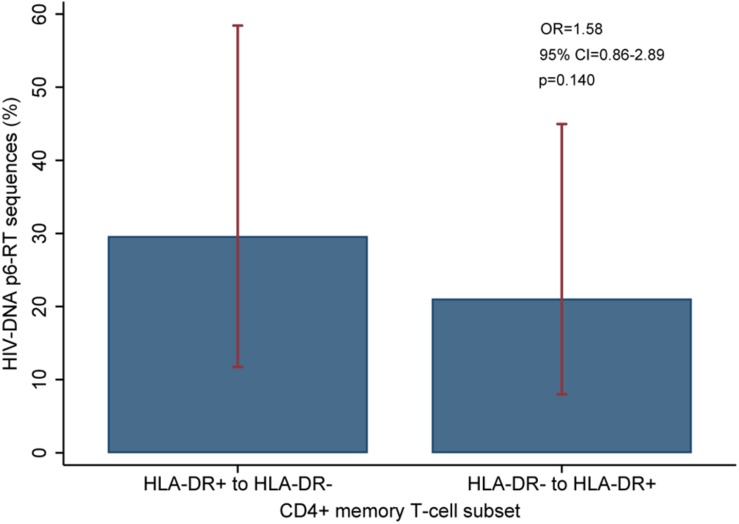
FIGURE 10.
Overall comparison of the HIV-DNA p6-RT sequences that switch between HLA-DR+ and HLA-DR– CD4+ T-cell subsets during ART. The percent of viral sequences derived from the HLA-DR+ T-cell subset from the three early time points which were identical to at least one (HLA-DR–)-derived viral sequence from the last time point is indicated as “HLA-DR+ to HLA-DR–”. The percent of viral sequences derived from the HLA-DR– T-cell subset from the three early time points which were identical to at least one (HLA-DR+)-derived viral sequence from the last time point is indicated as “HLA-DR– to HLA-DR+”. The percent was estimated from the mixed-effects logistic regression fitted to all participants (blue bar). The 95% CIs of the percent values are shown as red capped lines. The odds ratio (OR) and its 95% CI and p-value compare “HLA-DR+ to HLA-DR–” versus “HLA-DR– to HLA-DR+”.

