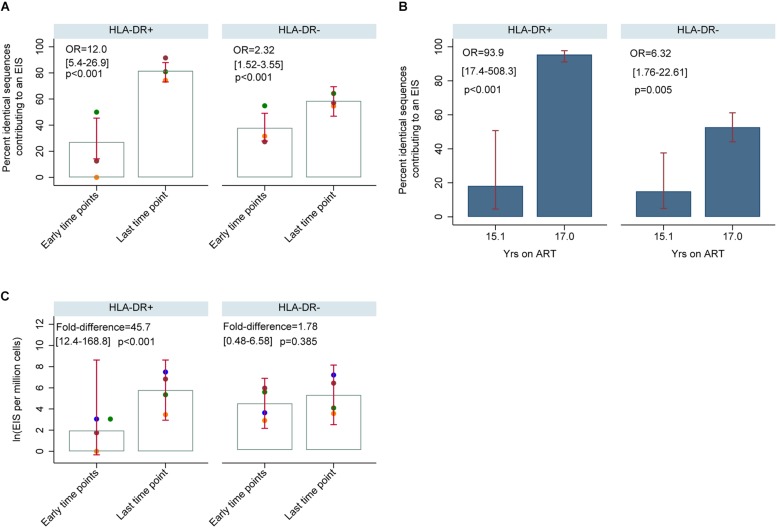
FIGURE 11.
HIV-DNA p6-RT sequences derived from EIS within HLA-DR+ and HLA-DR– CD4+ memory T-cells during therapy (CHI participants). (A) Percent of HIV-DNA p6-RT sequences derived from EIS (% EIS) for participants 2013 (orange data points), 2026 (green data points) and 2046 (maroon data points). EIS was characterized using HIV-DNA sequences derived from the three earlier time points combined (“Early time points”) and the viral sequences derived from last time point (“Last time point”). The odds ratio (OR) compares “Last time point” to “Early time points.” The 95% CI (in square brackets) and the p-value (p) of the OR are also shown. The open gray bars indicate mean % EIS and the 95% CI of the mean is shown as the red capped lines. (B) Percent of HIV-DNA p6-RT sequences derived from EIS (% EIS) for participant 2518. The OR compares 17.0 to 15.1 years of ART. The 95% CI (in square brackets) and the p-value (p) are also shown. The filled blue bars indicate % EIS and its 95% CI is shown as the red capped lines. (C) Quantity of HIV-DNA sequences derived from EIS per million cells analyzed within the HLA-DR+ and HLA-DR– T-cell subsets. The gray open bars indicate mean of log transformed EIS per million cells and red capped lines indicate 95% CI of this mean. The fold-difference compares EIS per million cells of “Last time point” to “Early time points.” The 95% CI (in square brackets) and p-value (p) of the fold-difference are also shown. Different colors of the data points represent different participants; 2013 (orange), 2026 (green), 2046 (maroon), and 2518 (blue).

