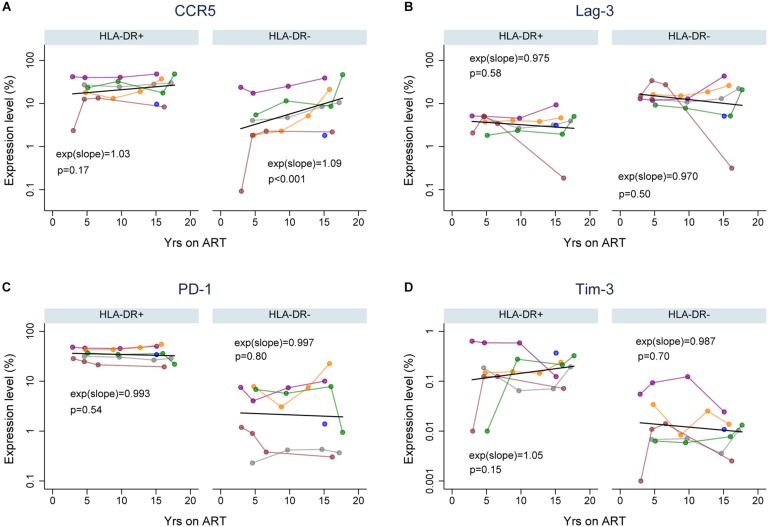
FIGURE 2.
Expression of cellular activation/exhaustion markers on HLA-DR+ and HLA-DR– CD4+ memory T-cells during ART. Proportions of HLA-DR+ and HLA-DR– CD4+ memory T-cells that express CCR5 (A), LAG-3 (B), PD-1 (C), and Tim-3 (D). The colors of data points and lines indicate different participants; 2115 (gray), 2275 (purple), 2013 (orange), 2026 (green), 2046 (maroon), and 2518 (blue). A linear prediction was performed on the log transformed values using mixed-effects linear regression (black line). The changes of expression levels per year on therapy are indicated by exp(slope) (or eslope). An e(slope) greater than 1 indicates an increasing rate and less than 1 indicates a decreasing rate of expression. The p-values (p) are derived by comparing the slopes to the null hypothesis of slope = 0, or e(slope) = 1.

