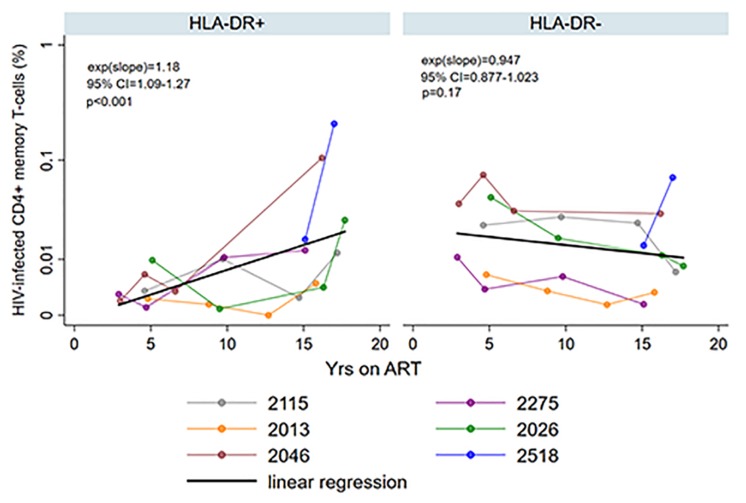
FIGURE 3.
Persistence of HIV-infected HLA-DR+ and HLA-DR– CD4+ memory T-cells during ART. The proportion of HIV-infected T-cells (%) was estimated using maximum likelihood model derived from single-proviral sequencing. The change in the frequency of HIV-infected T-cells per year on ART [exp(slope)] was derived from mixed-effects negative binominal regression (black line). The 95% confidence intervals (95% CI) and p-value of the exp(slope) are also shown. The colors of the data points and the lines indicate different participants as shown in the legend.

