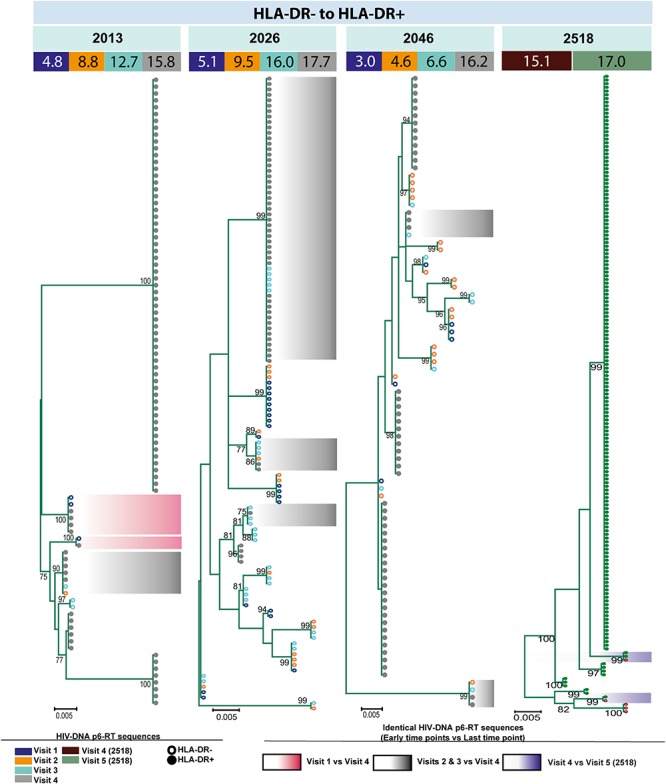
FIGURE 9.

HIV-DNA p6-RT sequences from HLA-DR– T-cells that are identical to sequences from the HLA-DR+ T-cells during ART. Maximum likelihood phylogenetic trees using HIV-DNA sequences derived from monophyletic clades that show sequences from the first time points of HLA-DR– T-cells being identical to sequences from HLA-DR+ T-cells at the last time point (HLA-DR– to HLA-DR+). The trees were constructed for all CHI participants. The sampling time points (years after ART initiation) for individual HIV-DNA sequences are indicated under the participant IDs. The viral sequences derived from different sampling time points are shown with different colors that correspond to the visit IDs as shown in the legend. The shades indicate phylogenetic clades that contain identical HIV-DNA sequences derived from the HLA-DR– T-cells obtained from the three earlier time points and the HLA-DR+ T-cells from the last time point.
