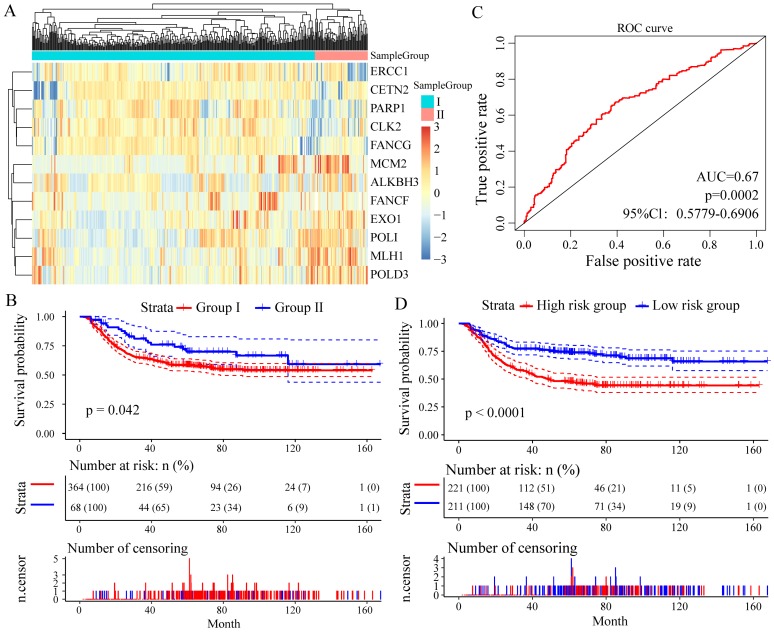
Figure 5.
Relationship between different expression patterns of 13 key DNA repair genes and GC prognosis in the test set. A. Clustering analysis of 13 key DNA repair gene expression profile, horizontal axis divides the sample into 2 groups; B. Kaplan-Meier method and log-rank test of the prognosis difference between patients in indicated clusters; C. Receiver operating characteristics (ROC) curves for overall survival in the training set. P values show the area under the ROC (AUROC) of 13 DNA repair genes gene signature; D. Kaplan-Meier method and log-rank test of the prognosis difference between patients in indicated group.

