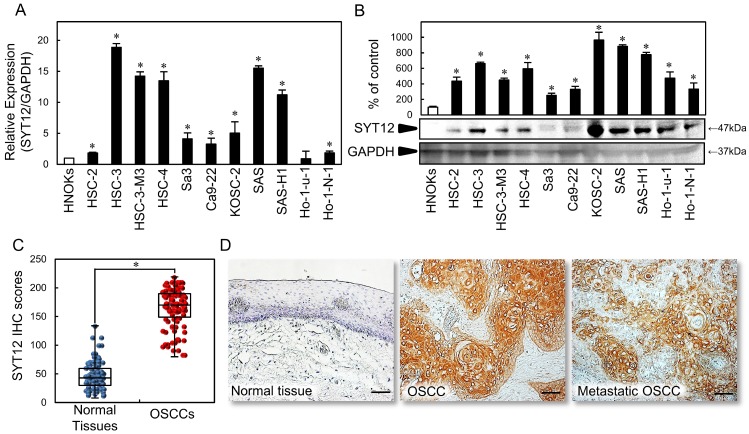
Fig 1.
SYT12 expression in OSCC-derived cell lines and primary OSCCs. (A) Quantification of SYT12 mRNA expression in OSCC-derived cell lines by qRT-PCR analysis (N=3). (B) Representative immunoblot analysis of SYT12 protein expression. The densitometric SYT12 protein data are normalized to GAPDH protein levels. The values are expressed as a percentage of the HNOKs (N=3). (C) The SYT12 IHC scores of the normal oral tissues and OSCCs (N=112). (D) Representative IHC results for SYT12 protein in normal tissue, primary OSCCs, and metastatic regional lymph nodes. Original magnification, x200. Scale bars, 50 μm.

