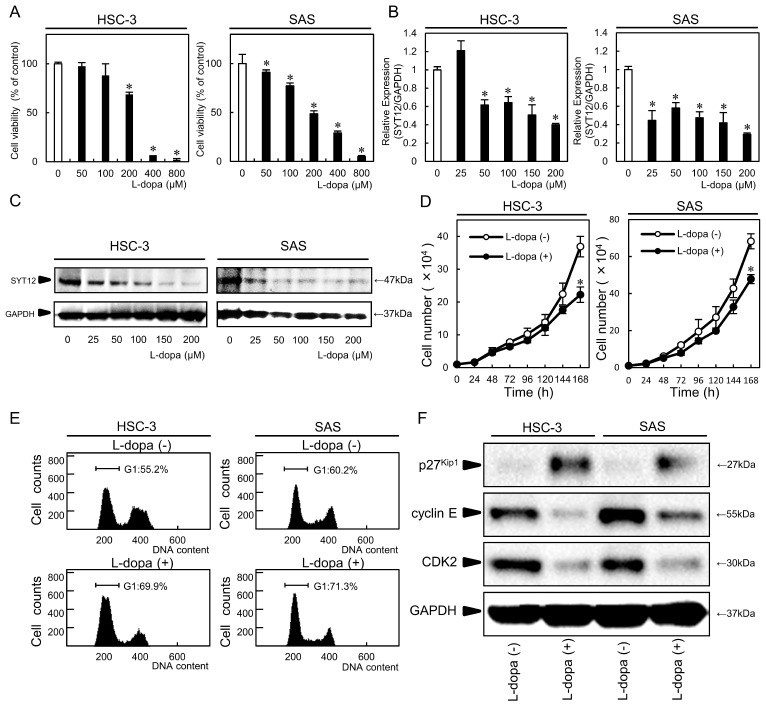
Fig 4.
L-dopa treatment. (A) An MTS assay shows a significant decrease in cellular viability above L-dopa concentrations of 200 µM in a concentration-dependent manner (N=3). (B, C) L-dopa concentrations above 50 µM inhibit SYT12 mRNA and protein expression levels in the L-dopa-treated cells compared with controls (N=3). (D) The cellular growth of the L-dopa-treated cells is significantly (P < 0.05) lower than that of the control cells after 7 days (168 h) (N=3). (E) A flow cytometric analysis shows the percentage of L-dopa-treated cells in the G1 phase is increased compared with the control cells (N=3). (F) Immunoblot analysis shows up-regulation of p27Kip1 and down-regulation of CDK2 and cyclin E in the L-dopa-treated cells compared with the control cells (N=3).

