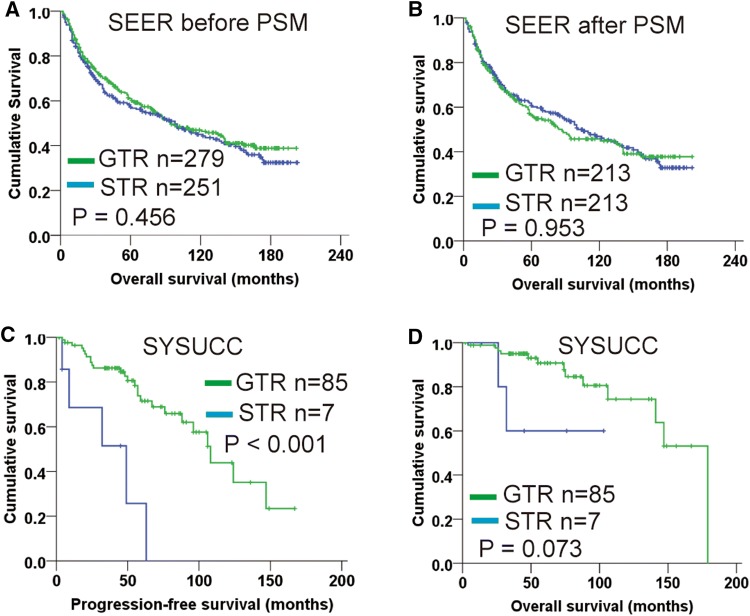
Fig. 1.
Kaplan–Meier plot for extent of resection on patients with high-grade meningiomas. a Overall survival analysis for SEER cohort before PSM; b Overall survival analysis for SEER cohort after PSM; c Progression-free survival analysis for SYSUCC cohort; d Overall survival analysis for SYSUCC cohort. PSM propensity score matching, GTR gross total resection, STR subtotal resection

