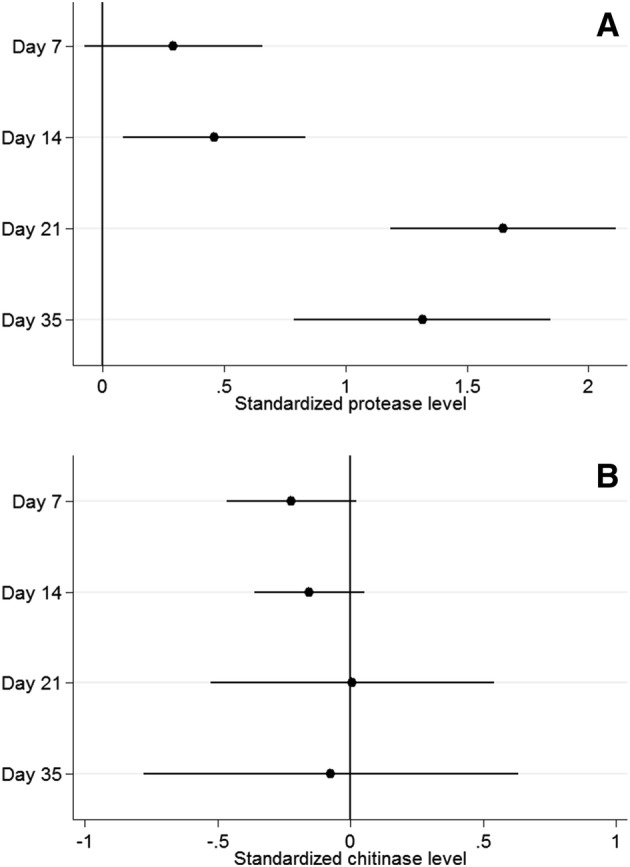
Fig. 3.

Results from mixed-effects multilevel models. a Salivary protease level and as a function of day of experiment. b Salivary chitinase level as a function of day of experiment. Estimates given are the standardised regression coefficients (95% confidence interval). Both analyses were adjusted for the standardised protein level
