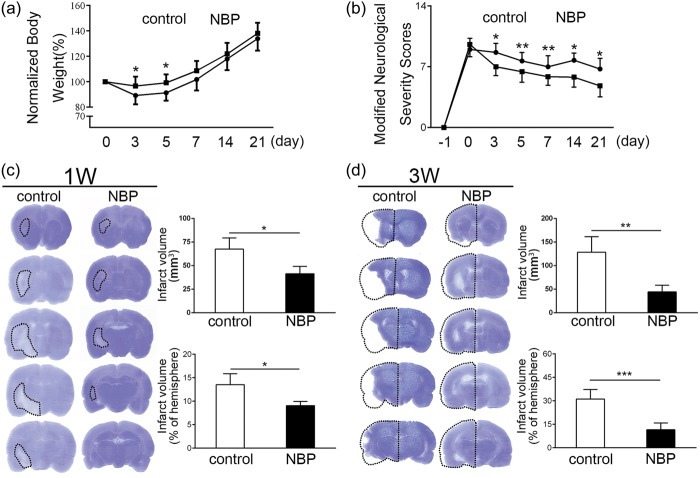
Figure 2.
The effect of NBP on the reduction of brain injury. (a) Body weight from the day 0 to the day 21 was all presented as normalized by comparing with the original body weight itself. In the early day 3 and day 5, normalized body weight in the NBP group was significantly higher than the control group. (b) After tMCAO model was established, modified neurological severity scores were tested until the rats were all sacrificed, in which the higher score represents a more serious deficit. The score in the NBP group was lower than the control group, which showed a significant neuroprotective effect of NBP on the ischemic rats. (c) The brain infarction was detected by Cresyl violet, which was circled by the dashed line, and the results were presented in volume and proportion. Both the infarction volume and proportion in the NBP group were significantly decreased than the control group. (d.)The brain atrophy was also detected by Cresyl violet, the dashed line represented the inversing contralateral that had no ischemia. Atrophy was calculated by using the volume of contralateral minus the volume of ipsilateral, and the results involved the atrophy volume and the proportion. Both the atrophy volume and proportion were significantly decreased than the control group. *p < 0.05, **p < 0.01, ***p < 0.001.

