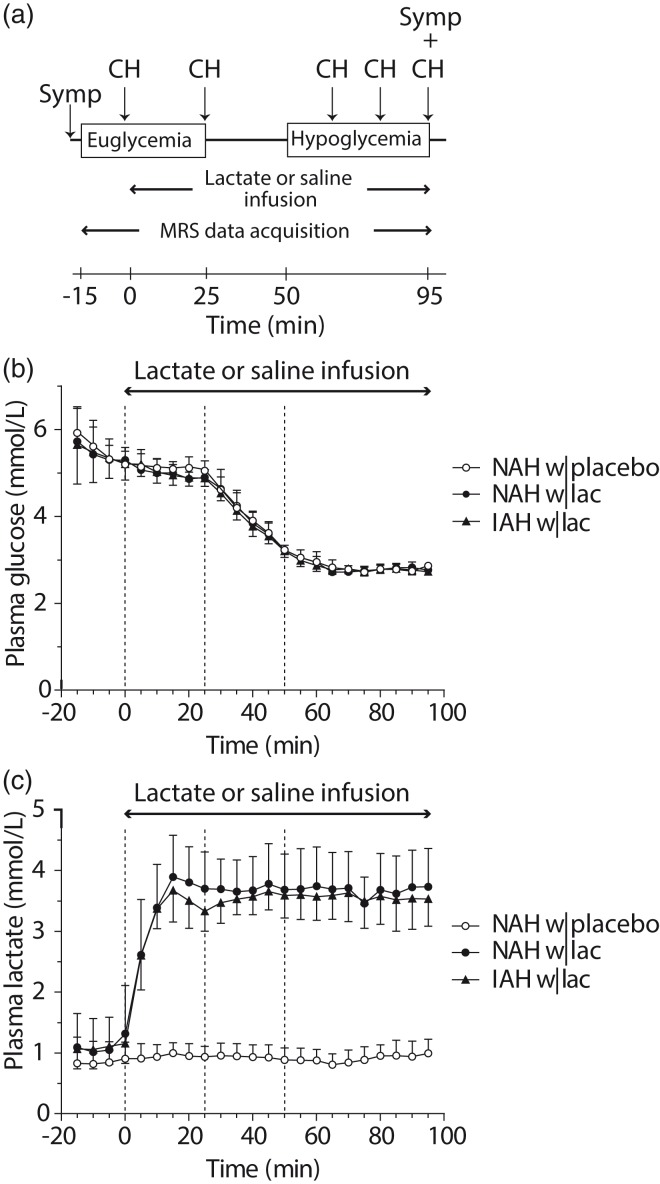
Figure 1.
Study protocol, plasma glucose and plasma lactate levels. (a) Schematic overview of the study protocol. MRS measurements were performed continuously during euglycemia and hypoglycemia. Counterregulatory hormone responses (CH) and hypoglycemic symptoms (Symp) were determined at several time points during euglycemia and hypoglycemia, as indicated. (b) Time courses of plasma glucose and (c) plasma lactate levels. The dashed lines represent the start of the lactate or saline infusion (T = 0 min), the end of euglycemia, and the start of hypoglycemia. Open circles: patients with type 1 diabetes and NAH with saline infusion (NAH w|placebo); black circles: patients with type 1 diabetes and NAH with lactate infusion (NAH w|lac); black triangles: patients with type 1 diabetes and IAH with lactate infusion (IAH w|lac).

