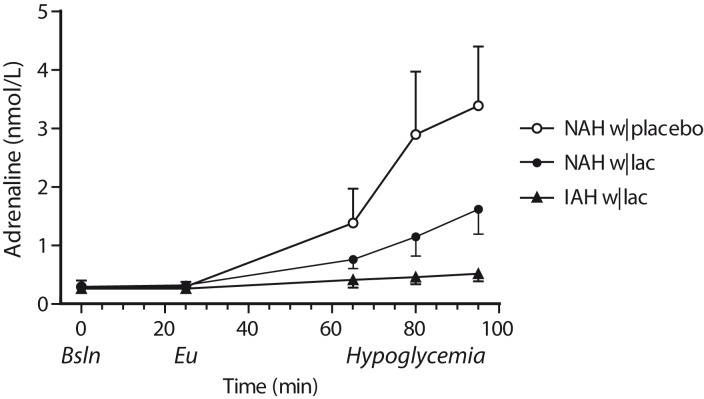
Figure 4.
Adrenaline responses. Adrenaline levels were determined at baseline (Bsln; i.e. before the infusion of lactate or saline), during euglycemia (Eu) and at 15-min intervals during hypoglycemia. Open circles: patients with type 1 diabetes and NAH with saline infusion (NAH w|placebo); black circles: patients with type 1 diabetes and NAH with lactate infusion (NAH w|lac); black triangles: patients with type 1 diabetes and IAH with lactate infusion (IAH w|lac).

