Figure 2.
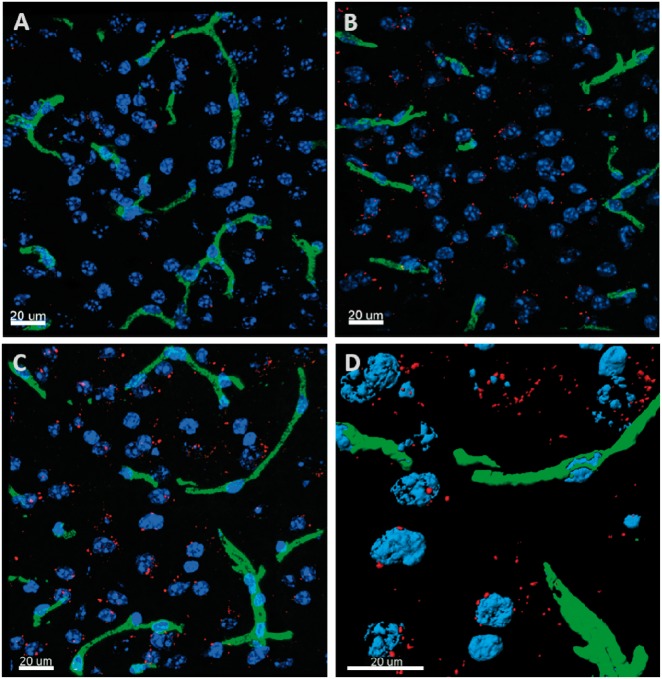
Representative 3D confocal image of brain distribution of different constructs based on the mAb NIP228 a hIgG1TM 2 h after IV administration in CD-1 female mice. Cell nuclei are blue (DAPI) and capillaries are green (Texas Red). (a) represents the distribution of the NIP228 labelled with Alexa F647 (red); (b) represents the distribution of MTf chemically conjugated to NIP228 labelled with Alexa F647 (red); (c) represents the distribution of MTfpep chemically conjugated to NIP228 labelled with Alexa F647 (red); (d) shows magnified surface rendered (quantified) Texas Red labelled blood capillaries (green) and MTfpep chemically conjugated to NIP228 labelled with Alexa F647 (red). These 3D images demonstrate that the brain parenchyma distribution is much higher for labelled NIP228 incorporating full-length MTf or MTfpep compare to NIP228 alone. See method section for the details of the quantitative procedures. Scale bar represents 20 µm.

