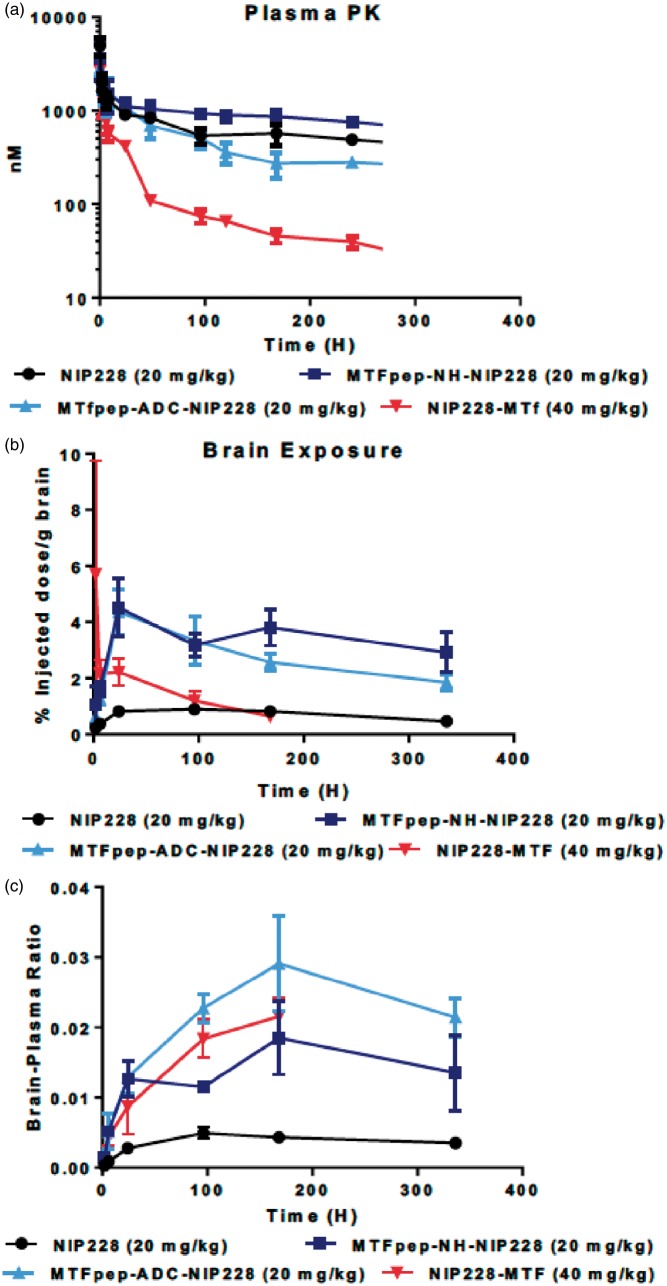
Figure 4.
Plasma and brain exposure of MTf or MTfpep targeted IgGs in a mouse PK assay. (a) Plasma PK of MTf or MTfpep targeted hIgG1TM compared to a non-targeted isotype control (NIP228) over a two-week period. (b) Brain exposure as a measure of % injected dose per gram of brain. (c) Comparison of brain:plasma ratio. All molecules dosed at the same molar concentration. N = 6 per group. PK: pharmacokinetic. S.E.M provided for each measured point indicated.

