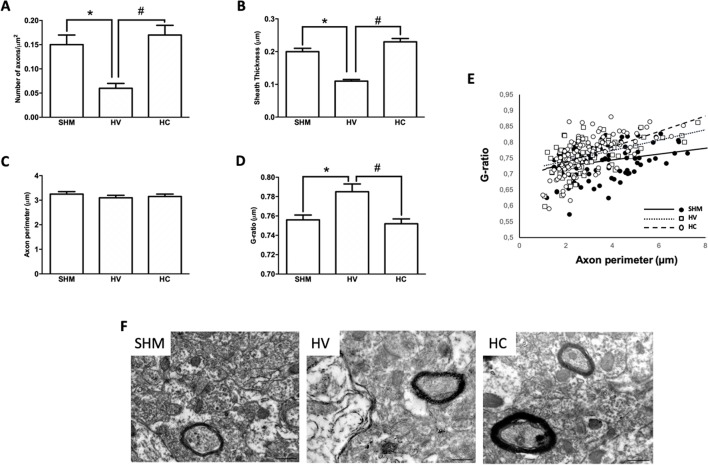
Figure 4.
Myelin study in cerebral cortex by electron microscopy Electron microscopy studies performed in the parieto-occipital cortex 30 days after a hypoxic-ischemic (HI) insult induced in P7–10 Wistar rats then receiving vehicle (HV) or cannabidiol (HC), or a similar period in control rats (SHM). (A) Number of axons (B) myelin sheath thickness (C) Axon perimeter (D) g-ratio (E) Dots and trend lines representing the relationship between axon size and g-ratio values (F) Representative micrographs. Bars represent mean ± SEM. Scale bar: 10 µm. *p < 0.05 vs SHM; #p < 0.05 vs HV), by ANOVA.

