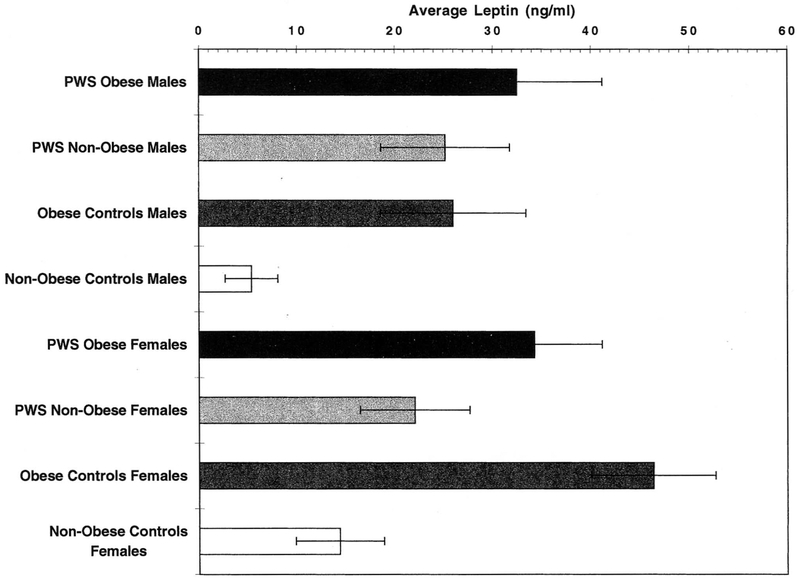
Fig. 1.
Histogram showing plasma leptin levels in Prader-Willi syndrome and control subjects. Significant differences in plasma leptin levels were found (P < 0.05) using the Fishers paired least significant difference test for the following: 1) Non-obese control females > non-obese control males; 2) Obese control females > non-obese control females; 3) Obese control males > non-obese control males; and 4) PWS non-obese males > non-obese control males.

