Fig. 7.
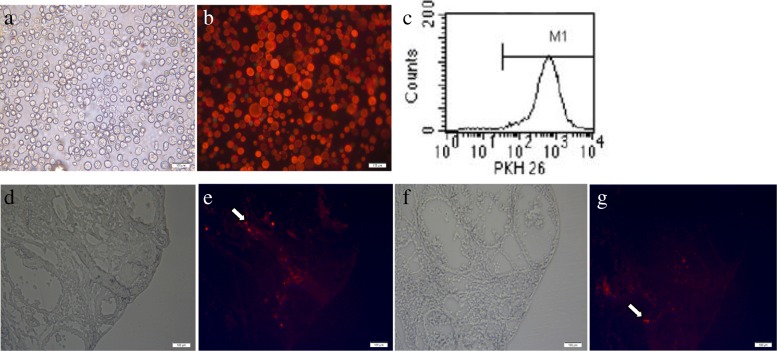
In vivo hAMSCs tracking. a, b PKH26-labelled hAMSCs showed red fluorescence (× 100). c The labelling rates of PKH26-labelled hAMSCs were detected by flow cytometry. Transplanted hAMSCs were observed at 7 (d, e) and 14 (f, g) days after cell transplantation in ovaries (× 100, n = 3). d and f show the bright field under a fluorescence microscope, and e and g show the dark field (× 100)

