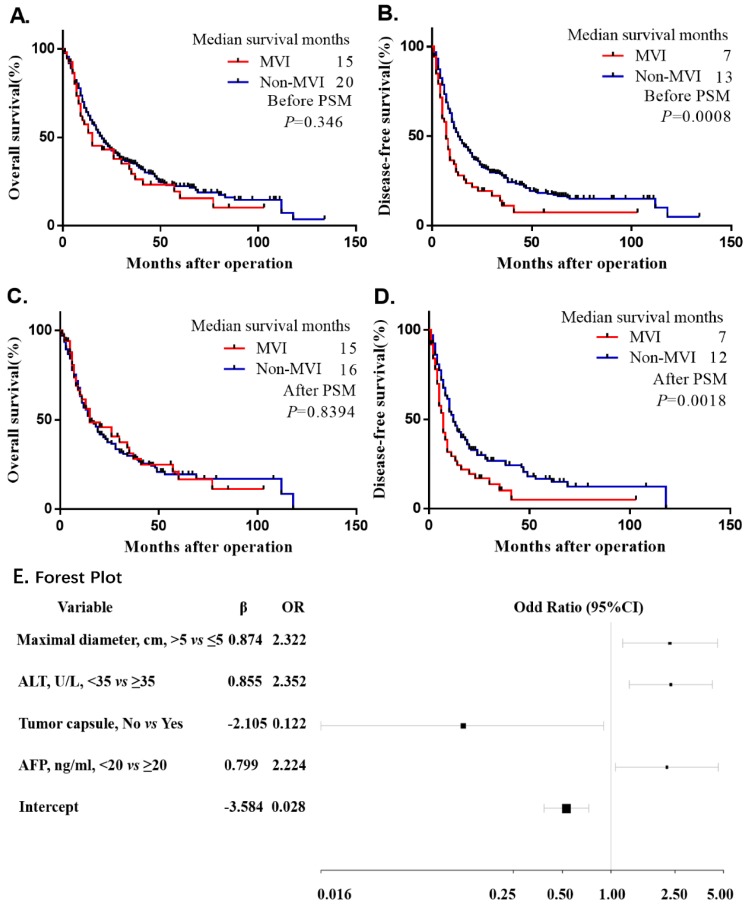
Figure 2.
Kaplan-Meier survival plot of OS and DFS before and after PSM. The survival curve of overall survival and disease-free survival in unadjusted model (A.B.). The survival curve of overall survival and disease-free survival after matched (C.D.). Multivariate Logistic Regression Analysis the risk factors of MVI Presence Based on Preoperative Data in the Training Cohort and forest plot drawn. Abbreviations: ALT, alanine transaminase; AFP, alpha-fetoprotein; OR, odds ratio. Unstandardized β coefficients were calculated from the multivariate logistic regression model (E).

