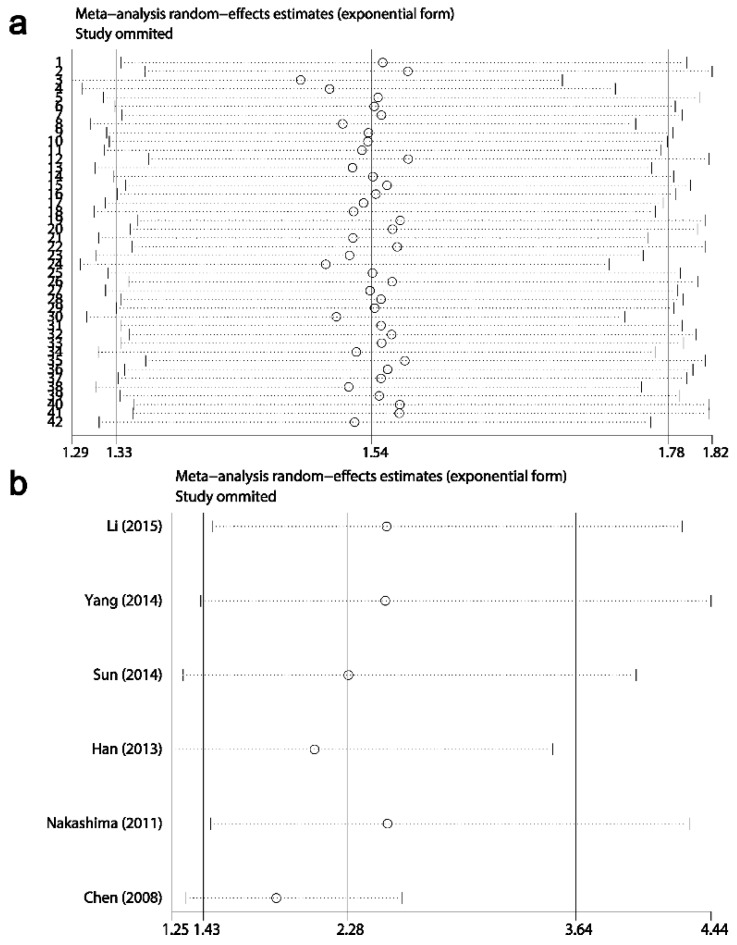
Fig 6.
Result of sensitivity analysis from a random-effects model for overall survival (a) and disease-free survival (b). Three vertical lines indicated the pooled hazard ratio (HR) with 95% confidence interval (CI) calculated from all included studies. Each dotted horizontal line belongs to an independent meta-analysis. And the middle circle and two sides' short vertical lines represents the pooled HR and its 95% CI corresponding to the successive exclusion of each study.

