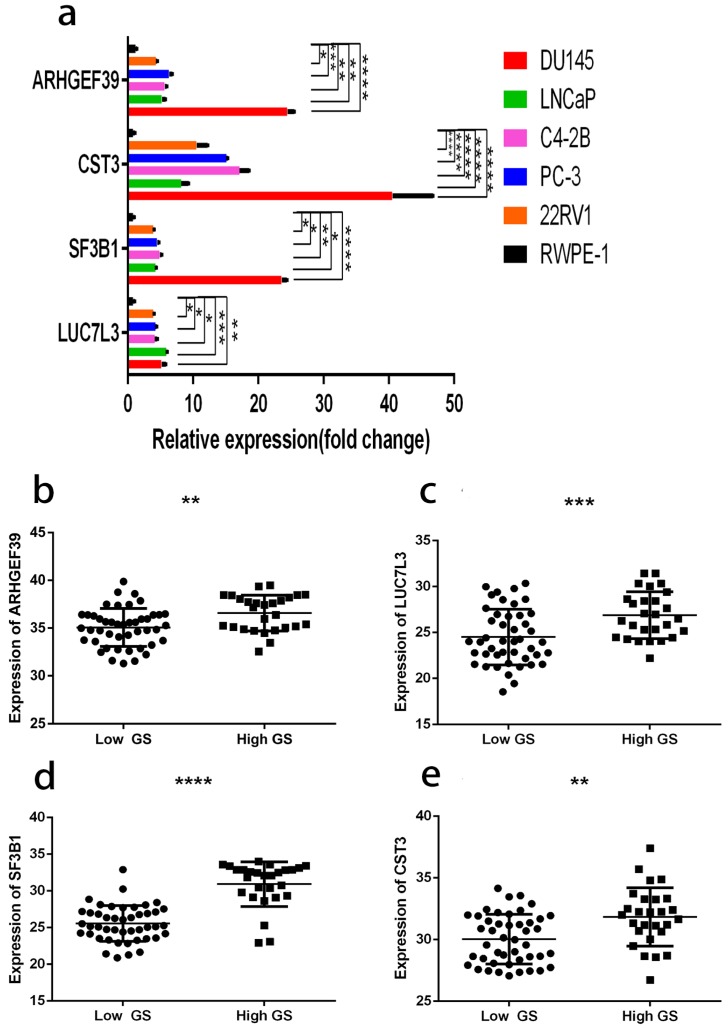
Figure 12.
a, gene expression profiles in different cell lines. b, ARHGEF39 expression profiles in clinical samples. c, LUC7L3 expression profiles in clinical samples. d, SF3B1 expression profiles in clinical samples e, CST3 expression profiles in clinical samples. In clinical samples, the target gene expression was normalized to β-actin (ΔCt) and compared with the maximum ΔCt. Data are presented as ΔΔCt. Results are presented as mean ± SD. *p <0.05, **p < 0.01, ***p < 0.001, ****p < 0.0001.

