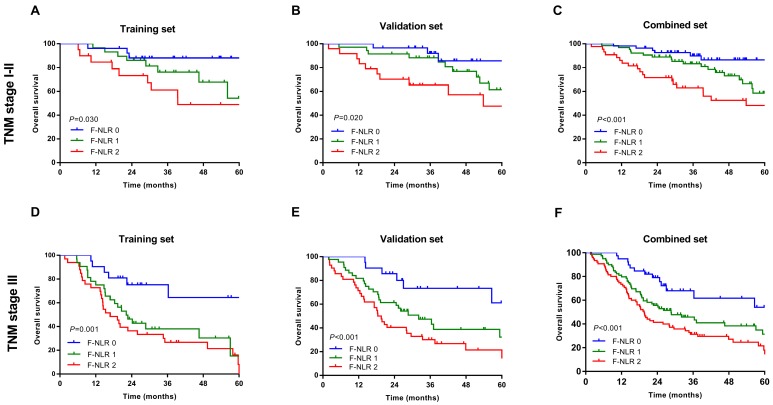
Figure 2.
Survival curves based on the F-NLR of AEG and UGC patients (TNM stage I-III). A-C, Overall survival (OS) of patients with TNM stage I-II with F-NLR=0, F-NLR=1, and F-NLR=2 in the A, training set (P =0.030); B, validation set (P =0.020); and C, combined set (P <0.001). D-E, Overall survival (OS) of patients with TNM stage III with F-NLR=0, F-NLR=1, and F-NLR=2 in the A, training set (P=0.001); B, validation set (P <0.001); and C, combined set (P <0.001).

